AI capital is moving to the constraints

This week’s AI Capital Signals looks at three capital events across different parts of the AI economy: Mistral AI, Google’s infrastructure expansion in Finland, and Positron.

The transactions are different. The underlying constraint is not.

As AI scales, capital is increasingly moving toward the resources that determine whether that scale is physically and economically possible — compute, power, and inference infrastructure.

The question is shifting from:

Who can build the most capable AI?

to:

Who can secure and control the resources required to run it at scale?

Our latest presentation examines the evidence, the economic logic behind the signal, the counter-thesis, and what would confirm or break it.

View Report

If you’d like to receive full versions of Solten Ventures research and future AI Capital Signals reports, subscribe for free: Request Full Access

The AI Build-Out Is Becoming an Infrastructure Allocation System

Why power, grid access, resilience and political permission are becoming part of AI economics.

SOLTEN VENTURES RESEARCH  |  FLAGSHIP REPORT  |  11 SEPTEMBER 2026  |  FULL ACCESS

AI Infrastructure  /  Energy  /  Data Centers  /  Capital Allocation

CENTRAL THESIS  The AI infrastructure race is moving beyond accelerator procurement. The increasingly scarce asset is permissioned, financeable, and resilient access to power, grid capacity, land, cooling, connectivity, and political consent. Recent events in Finland, Texas, PJM and the UAE show that AI capacity is becoming an allocation problem: projects must now compete not only for chips and capital, but for scarce physical-system capacity and the right to use it.


Research snapshot

Field Detail
Publication date 11 September 2026
Evidence cut-off 11 September 2026
Research type Flagship thematic and market-structure report
Primary audience Investors, family offices, infrastructure operators, strategy leaders
Estimated reading time 25–30 minutes
Core evidence boundary Public announcements, grid/operator data, government releases and selected reporting; no claim of complete global project coverage
Prior research connection Extends Power Is the New Compute and The Grid Is the New GPU from bottleneck analysis to allocation, reliability and political permission


Executive summary

The AI build-out is entering a phase in which physical infrastructure is no longer a passive input. It is becoming part of the competitive architecture. Google’s €13 billion Finland commitment ties digital expansion to a 22-year nuclear agreement, new wind capacity and a 94 MW battery system. Within a day, Finnish political debate shifted to electricity sufficiency, affordability and whether data centers require a national permitting regime.[1][2]

In Texas, ERCOT is no longer treating every large-load request as equally credible. It is batching, verifying and auditing projects after requests reached hundreds of gigawatts. In PJM, nearly 4 GW of data-center load disconnected unexpectedly during a July event, prompting proposed reliability standards for computational loads. In the UAE, a 5 GW campus conceived as a concentrated sovereign-AI asset is reportedly being reconsidered as a distributed, hardened network after attacks on regional infrastructure.[3][4][5]

These are not four versions of the same event. Together they reveal a change in the economic object being allocated. The relevant scarce resource is not electricity alone. It is usable capacity: power that can be delivered on time, at an acceptable cost, through a grid that can absorb the load, at a site that can be permitted, financed, cooled, connected and protected.

INVESTOR QUESTION  Which companies and assets control scarce, credible and defensible paths from announced AI demand to operating capacity – and which are merely reserving optionality in overloaded queues?


Key findings

  • Power scarcity is becoming a capacity-allocation problem. UNECE projects global data-center electricity consumption rising from about 485 TWh in 2025 to 950 TWh by 2030, but the constraint is geographically concentrated rather than globally uniform.[6]
  • Grid access is becoming a screening mechanism. ERCOT’s Batch Zero framework groups large loads of 75 MW or more and evaluates them against available system capacity instead of assuming every request can proceed independently.[3]
  • Project credibility is now economically material. Texas has required verification before projects advance; ERCOT reported more than 438 GW of large-load requests in June, nearly 89% from data centers.[3][7]
  • AI loads are becoming grid-operating actors, not ordinary customers. PJM’s July event showed that synchronized data-center behavior can create system-level reliability consequences even when generation supply is adequate.[4]
  • Energy procurement is becoming infrastructure strategy. Google’s Finland plan combines data centers, nuclear life extension, wind and battery storage rather than treating electricity as a commodity purchased after site selection.[1]
  • Resilience is moving into AI infrastructure design. The UAE case indicates that geopolitical threat can change optimal topology from concentrated scale toward distributed and hardened capacity.[5]
  • Political permission is becoming part of time-to-compute. Ratepayer protection, water, noise, land use, national security and grid reliability increasingly determine whether announced capacity becomes operating capacity.[2][7]
  • The investable distinction is shifting from “has power” to “has credible time-to-power.” Deposits, interconnection status, generation rights, transmission readiness, equipment procurement, permitting and community acceptance need to be underwritten together.
  • The counter-thesis matters: demand queues can exaggerate scarcity. Duplicate, speculative or underfunded requests can make future load look larger than realizable demand. Filtering may reduce the apparent infrastructure deficit.[3][7]
  • The next phase should reward assets that convert constraint control into utilization and cash flow. Merely owning land, a queue position or a power narrative is not sufficient.

Contents

Sections 1–6 Sections 7–12
1. What changed 7. Reliability becomes a design variable
2. From bottleneck to allocation 8. Resilience and sovereign AI
3. Finland: energy becomes strategy 9. Who captures value
4. Texas: queues become underwriting 10. Counter-thesis and falsification
5. Credible time-to-power 11. Scenarios and investor implications
6. Political permission 12. What to watch next


1. What changed

The earlier phase of the AI infrastructure cycle could be described as a procurement race: secure GPUs, networking equipment, high-bandwidth memory and enough capital to buy them. Power and interconnection were important, but often treated as site-development constraints downstream of the technology decision.

That sequence is breaking. The newest evidence shows power, grid behavior, permitting and resilience moving upstream into the strategic decision itself. Google is pairing compute expansion with long-duration nuclear procurement and storage. ERCOT is filtering projects before connection. PJM is proposing operational requirements because computational loads can affect system stability. The UAE is reportedly reconsidering physical topology because concentrated AI capacity is a security target.[1][3][4][5]

WHAT CHANGED  The scarce unit is no longer a megawatt in the abstract. It is a megawatt that can be delivered, financed, permitted, operated and defended on the required timetable.


This distinction matters because headline AI capacity increasingly mixes very different states: announced demand, queue requests, contracted utility service, permitted sites, energized capacity and operational compute. Treating those states as equivalent produces false precision.

Capacity state What it actually proves Primary risk
Announced Management intent Narrative / financing
Queue request A claim on future grid study Duplication / ghost demand
Contracted Commercial commitment exists Delivery / conditions precedent
Permitted Political and regulatory gate cleared Construction / equipment
Energized Power can reach the site Ramp / reliability
Operating Compute is producing workload Utilization / economics


2. From bottleneck to allocation

A bottleneck is a shortage. An allocation system is the mechanism that decides who receives the scarce resource, on what terms and with what obligations. AI infrastructure is moving from the first condition toward the second.

UNECE estimates data-center electricity use could rise from roughly 485 TWh in 2025 to 950 TWh by 2030, around 3% of global electricity demand. The aggregate number is less important than concentration: hyperscale loads arrive in specific substations, transmission zones and communities, often faster than generation and grid infrastructure can be built.[6]

EIA’s September outlook expects U.S. electricity sales of 4,135 BkWh in 2026 and 4,211 BkWh in 2027, with data-center development and manufacturing driving commercial and industrial growth. The forecast explicitly notes the pause in new Texas data-center connections while still identifying the West South Central region as the largest contributor to sales growth.[8]

ALLOCATION LAYERS  Generation → transmission → interconnection → site → cooling/water → equipment → permitting → community acceptance → cyber/physical resilience → operating load. A project can fail at any layer even when every other layer is available.


The result is a new hierarchy of assets. A nominally cheap site with uncertain interconnection may be less valuable than an expensive site with contracted firm power and a credible energization date. A power agreement without transmission may be a paper advantage. A fully energized campus that cannot withstand grid disturbances or political opposition may still carry hidden duration risk.

3. Finland: energy procurement becomes AI strategy

On 9 September, Google announced a €13 billion investment across Finland over two years, its largest single investment in Europe. The program includes new digital infrastructure and an energy portfolio: a 22-year agreement supporting the life extension of Fortum’s Loviisa nuclear plant, new onshore wind capacity and a 94 MW battery system.[1]

The strategic point is not simply that Google needs electricity. The company is helping shape the supply stack around its demand. Long-duration nuclear support improves firmness; wind adds energy; batteries can provide flexibility during tight periods. This is closer to infrastructure portfolio construction than ordinary utility procurement.

The political response arrived immediately. Finnish opposition parties raised concerns about future power shortages, prices and transmission capacity and called for a national permitting framework for data centers. The government argued that capacity was sufficient and emphasized economic benefits.[2]

INTERPRETATION  AI infrastructure can create national-scale benefits and national-scale trade-offs at the same time. Once a single project can contract for a material share of a nuclear plant’s output, energy allocation becomes a political-economic question, not only a corporate procurement decision.


Finland evidence Economic meaning
€13bn two-year investment Compute demand is large enough to reshape regional infrastructure planning
22-year nuclear agreement Firm power is being secured on infrastructure-duration contracts
94 MW battery + wind Reliability and price management are part of the compute stack
Permitting debate Political consent can become a gating asset


4. Texas: the queue becomes an underwriting problem

Texas illustrates the opposite failure mode: not insufficient ambition, but too many claims on future capacity. In June, ERCOT said it was tracking more than 438,000 MW of large-load requests, nearly 89% from data centers. Its Batch Zero process groups qualified projects of 75 MW or more so the grid can assess the aggregate impact, allocate available capacity, and identify transmission upgrades.[3]

In August, the governor directed ERCOT and the Public Utility Commission to audit data-center projects before they advance. ERCOT began issuing verification requests in September. The policy logic is straightforward: a queue filled with projects that are duplicated, undercapitalized or commercially immature can cause the grid to plan and spend against demand that never materializes.[7][9]

This changes the meaning of interconnection position. A queue slot is no longer enough. Credibility increasingly requires evidence of ownership, funding, customer demand, deposits, site control, equipment plans, and willingness to accept curtailment or fund infrastructure.

UNDERWRITING RULE: Treat announced megawatts as a probability-weighted pipeline, not installed capacity. The relevant variable is expected energized MW × expected utilization × economic life – after transmission, generation, equipment and regulatory costs.


The paradox is important. Filtering “ghost demand” can reduce the apparent shortage while simultaneously increasing the value of projects that survive the filter. Scarcity may become less dramatic in aggregate but more valuable at the project level.

5. Credible time-to-power is becoming the asset

Traditional data-center analysis often separates real estate, power procurement, and compute hardware. AI compresses those decisions because accelerator generations turn over faster than grid infrastructure. A site that energizes three years late can miss the hardware and customer window it was designed to serve.

That makes time-to-power a composite asset. It depends on more than generation. Transmission studies, substations, transformers, switchgear, gas turbines, cooling equipment, construction labor and permits can each become the critical path. The value of early access rises when the cost of idle compute demand is high.

Evidence to underwrite Stronger signal Weak signal
Power Firm/contracted supply with delivery path Non-binding “access to X GW” claim
Grid Completed study / funded upgrades Early queue position only
Site Controlled, permitted, serviced Land option without infrastructure
Equipment Long-lead items ordered Vendor discussions
Demand Contracted customer / credible internal load Pipeline or LOI
Capital Committed funding matched to milestones Headline financing need
Resilience Tested operating architecture Backup described but unproven


For investors, this creates a diligence shift. The key question is not “How many gigawatts are planned?” but “What evidence converts each gigawatt from narrative into an executable capacity claim?”

VALUATION IMPLICATION: The market may increasingly place a premium on de-risked capacity: energized sites, transferable interconnection rights where permitted, firm generation, grid-ready campuses and operating platforms with demonstrated load management. But the premium should be tied to evidence, not to the vocabulary of scarcity.


6. Political permission enters the cost stack

Data centers are unusually visible industrial loads. They can bring investment, construction, tax revenue and digital infrastructure while also concentrating electricity demand, water use, transmission needs, noise and land-use effects. As projects scale, those externalities move from local planning questions into state and national policy.

Texas has explicitly directed that data centers fund infrastructure needed to serve them and has linked future policy to water efficiency, reporting and neighborhood impacts. Finland’s debate is focused on national permitting, power adequacy and affordability. UNECE frames data-center growth as an issue spanning reliability, water and land use, economic development, digital sovereignty and local communities.[2][6][10]

Political permission therefore has an economic duration. A project can possess land, capital and hardware and still lose years to changing connection rules, cost-allocation disputes or community resistance. Conversely, jurisdictions that create credible, transparent large-load frameworks may attract higher-quality projects even if requirements are stricter.

INVESTABLE CONSEQUENCE: The best jurisdiction is not necessarily the one with the fewest rules. It may be the one where rules make time-to-power, cost allocation, and operating obligations predictable enough to finance.


7. Reliability becomes a design variable

AI data centers do not only consume large amounts of electricity. Their power electronics, protection settings, backup systems and workload behavior can interact with the grid at very large scale.

PJM reported that nearly 4,000 MW of data-center load unexpectedly disconnected in northern Virginia during a July 22 event and shifted to backup generation. Operators had to manage resulting imbalances and voltage and frequency effects. PJM said it was the third measurable event of this kind in two years and proposed changes to reliability requirements for large computational loads.[4]

This is a structural change in the customer-grid relationship. At multi-gigawatt scale, a synchronized load response can resemble the sudden loss of a major generation resource. Protection behavior, ride-through capability, and coordination with system operators become infrastructure requirements.

WHAT THIS ADDS TO THE THESIS: Scarcity is not only about getting connected. The grid must be able to keep the load connected safely, and the load must behave in ways the grid can model. Operating compatibility becomes part of usable AI capacity.


The commercial implication extends beyond utilities. UPS systems, batteries, power-management software, switchgear, onsite generation and controls gain value when they help a campus meet both compute uptime requirements and grid operating standards.

8. Resilience and sovereign AI

The UAE case adds a different constraint: physical security. Stargate UAE was announced in 2025 as a 1 GW compute cluster within a 5 GW UAE-U.S. AI campus in Abu Dhabi, spanning roughly 10 square miles and backed by G42, OpenAI, Oracle, NVIDIA, Cisco and SoftBank.[11][12]

Reuters reported on 11 September 2026 that the UAE is revising the broader campus concept after Iranian attacks on U.S.-linked technology infrastructure in the Gulf. The reported alternatives include distributing facilities across the country, hardening structures and placing some components underground.[5]

The redesign is not yet a completed public architecture, so the evidence should be treated as reported planning rather than final project specification. But the economic lesson is already visible: concentration maximizes some scale economies while also concentrating geopolitical and physical-security risk.

SOVEREIGN-AI TRADE-OFF  The optimal AI campus is no longer defined only by PUE, latency and construction cost. For strategic national capacity, survivability, geographic dispersion, supply-chain security and continuity under attack can justify higher unit cost.


This widens the definition of AI infrastructure from a technology asset to critical infrastructure. Once governments treat compute capacity as strategic, security requirements can reshape site selection, network topology, redundancy and capital intensity.

9. Who captures value if the thesis is right

An allocation system creates value at control points. The beneficiaries are not automatically the largest builders; they are the actors that control scarce transitions from demand to usable capacity.

Control point Potential beneficiary What must be proven
Firm generation Utilities, IPPs, nuclear/gas/storage owners Deliverability and contract economics
Grid access Energized sites, transmission-ready developers Transferability, timing, upgrade cost
Power equipment Transformers, switchgear, turbines, storage Backlog converts to margin, not only capex
Load management Controls, batteries, power software Reliability value measurable in operations
Cooling/water Efficient thermal infrastructure Performance at AI rack densities
Resilience Distributed/hardened infrastructure providers Security premium exceeds added cost
Development platform Integrated data-center developers Pipeline survives permitting and financing filters


The losers are easier to describe: projects whose economics depend on cheap grid power arriving on an optimistic schedule; developers monetizing queue position without credible execution; and capital structures that assume every announced megawatt reaches high utilization quickly.

The strongest businesses should be able to show a conversion funnel from controlled resource to energized capacity to contracted workload to cash flow. Without that chain, “AI infrastructure” can become a label attached to long-duration development risk.

10. The strongest counter-thesis

The strongest challenge to this report is that the infrastructure shortage may be overstated because the demand signal itself is distorted. Large customers can submit overlapping requests across utilities and regions before final site selection. Developers can reserve options without full financing. Forecasts can then count multiple versions of the same future load.

Texas is already responding to this problem. ERCOT’s verification process and the state audit are designed to distinguish executable projects from speculative demand. If similar filtering materially reduces queues, some projected generation and transmission deficits could narrow.[3][7][9]

A second challenge is technological efficiency. Better accelerators, lower-precision inference, model efficiency, workload scheduling and utilization can reduce electricity required per unit of useful AI output. If efficiency improves faster than demand expands, infrastructure intensity could undershoot current expectations.

A third challenge is capital discipline. High power prices, ratepayer resistance, financing costs and weak end-user monetization could slow the build-out before physical constraints become permanently scarce.

FALSIFICATION TEST  The thesis weakens if verified large-load pipelines fall sharply after audits, energization lead times normalize, capacity prices and interconnection costs fall, AI workload growth decelerates, or efficiency gains consistently offset demand growth. It strengthens if credible projects continue to compete for firm power, regulators impose allocation rules, and operating AI loads require dedicated reliability standards.


11. Scenarios for 2027–2030

Scenario What happens Investment read-through
A. Managed allocation Queues are filtered; utilities add supply; rules stabilize. Scarcity remains local but financeable. Premium shifts to de-risked sites and integrated operators; fewer speculative projects.
B. Persistent constraint AI demand outruns grid and equipment build-out. Firm power and energization rights remain scarce. Strong pricing power at control points; higher capex and political scrutiny.
C. Political rationing Ratepayer, water, security or land concerns trigger tighter permitting and cost allocation. Jurisdiction selection dominates; stranded-development risk rises.
D. Demand reset AI economics disappoint or efficiency offsets load growth; queues collapse. Scarcity premiums unwind; overleveraged developers and equipment expansion exposed.


Investor implications

  • Underwrite capacity by stage, not by headline gigawatts. Assign explicit probabilities to queue, contracted, permitted, energized and operating capacity.
  • Treat power contracts as infrastructure documents. Examine term, firmness, curtailment, delivery node, transmission dependencies, escalation and counterparty risk.
  • Separate demand scarcity from queue scarcity. A crowded queue can reflect real demand, duplicated optionality or both.
  • Price political and reliability obligations into time-to-power. Faster permitting can be offset by cost-allocation rules, water limits or new grid-code requirements.
  • For equipment suppliers, distinguish durable bottlenecks from temporary backlog. Capacity expansion can destroy scarcity economics if demand is overstated.
  • For sovereign AI, model resilience as an operating requirement rather than a discretionary security overlay.
DECISION RULE: Do not pay for “power access” until the path from resource to energized, reliable, and permitted compute is evidenced. The asset is not the capacity claim. The asset is credible conversion.


12. What to watch next

Indicator Why it matters Thesis effect
ERCOT Batch Zero verification results Reveals how much requested load survives credibility screening High survival strengthens; large collapse weakens
PJM large-load reliability rules Shows whether computational loads become a distinct grid class Formal standards strengthen
Finland permitting / power-policy response Tests political acceptance of hyperscale energy concentration Tighter allocation strengthens
Google/Fortum execution Tests long-duration nuclear + storage model Successful delivery strengthens
UAE campus redesign Tests whether resilience changes topology at sovereign scale Distributed hardening strengthens
Interconnection lead times / deposits Measures scarcity and project seriousness Persistent cost/time strengthens
Data-center utilization and contracted backlog Connects infrastructure build to end demand Weak utilization weakens
Equipment lead times Tests whether physical supply chain remains binding Normalization weakens selected control points


Conclusion

AI infrastructure is becoming an allocation system because the industry is colliding with assets and institutions that cannot scale at software speed. Electricity must be generated and transmitted. Grid operators must maintain stability. Communities and governments decide what can be built. Critical infrastructure must survive faults, cyber incidents and, in some jurisdictions, physical attack.

This does not mean every power asset becomes an AI asset or every data-center project deserves a scarcity premium. The opposite discipline is required. As queues become crowded and narratives become larger, the analytical task is to distinguish claims on future capacity from credible operating capacity.

The strategic shift is therefore from compute procurement to infrastructure conversion. The winners should be those that can repeatedly convert capital, power, grid access, equipment, permission and resilience into usable compute on a timetable customers will pay for.

BOTTOM LINE  The next scarce AI asset may not be a chip. It may be the verified right and practical ability to turn electricity, land and infrastructure into reliable compute.


Methodology, limitations and sources

Research method

This report is an event-driven thematic study. It begins with recent events that alter the constraints around AI infrastructure, then tests whether those events share a common economic mechanism. The report does not aggregate unlike commitments into a single capital-flow number. Corporate capex, grid requests, power contracts and sovereign infrastructure plans are treated as different evidence classes.

Evidence discipline

  • Primary sources are preferred for announced terms, operator actions and official forecasts.
  • Reuters is used where the relevant fact is reported from sources, and no equivalent final public document exists, notably the UAE redesign.
  • Facts are separated from interpretation; forward-looking claims are framed as scenarios or monitoring tests.
  • Queue requests are not treated as built capacity. Announced investment is not treated as realized expenditure.
  • No claim is made that the selected events represent a complete global census of AI infrastructure.

Applicability & completeness

Venture Deal Research Protocol: not applicable. This report does not underwrite a financing or acquisition. Market-structure, infrastructure, policy, counter-thesis, falsification and monitoring gates are applicable and included. Evidence cut-off: 11 September 2026.

Selected sources

[1] Google, “Google deepens its commitment to Finland with a €13 billion investment in AI infrastructure,” 9 Sep 2026. blog.google/innovation-and-ai/infrastructure-and-cloud/global-network/google-ai-commitment-to-finland/

[2] Reuters, “Finland risks strained power supply after Google AI deal, opposition warns,” 10 Sep 2026.

[3] ERCOT, “PUCT Approves ERCOT’s Batch Zero Process for Connecting Large Electricity Users,” 18 Jun 2026.

[4] PJM, “PJM Proposes Reliability Standards to Manage Large Load Disconnection Events,” 10 Sep 2026.

[5] Reuters, “UAE revises AI data center plan after Iranian attacks, sources say,” 11 Sep 2026.

[6] UNECE, “Datacentres threaten electricity system resilience,” 8 Sep 2026.

[7] Office of the Texas Governor, “Governor Abbott Directs Comprehensive Data Center Audit,” 3 Aug 2026.

[8] U.S. EIA, Short-Term Energy Outlook/electricity, 9 Sep 2026.

[9] ERCOT Market Notice M-A090926-01, “Issuance of Batch Zero Verification Requests for Information,” 9 Sep 2026.

[10] Office of the Texas Governor, “Governor Abbott Directs PUC And ERCOT To Shield Texans From Data Center Infrastructure Costs,” 10 Jun 2026.

[11] OpenAI, “Introducing Stargate UAE,” 22 May 2025.

[12] G42, “Global Tech Alliance Launches Stargate UAE,” 22 May 2025.

About Solten Ventures

Solten Ventures is an independent research and analysis firm focused on capital, companies, and the decisions between them. Our research examines structural changes in markets, investment activity, technology, and business performance. Full research access: soltenventures.com/research-access/

Disclaimer

This material is for informational and research purposes only. It is not investment, legal, tax, or other professional advice, and it is not a recommendation to buy, sell, or hold any security or asset. Public information may be incomplete or change after the evidence cut-off.

Stripe Is Buying the Control Plane for AI Economics

A fundamental analysis of OpenRouter, model-routing economics, and the strategic value of a neutral inference exchange.

SOLTEN & CO. RESEARCH  |  FLAGSHIP REPORT 

Software AI  /  AI Infrastructure  /  Capital & Deals  /  Agentic Commerce

CENTRAL THESIS  Stripe is buying the point at which model choice becomes a financial decision: which supplier handles a request, what it costs, how usage is recorded, who is billed, and who is paid. OpenRouter could become a cross-provider economic-control plane. Stripe ownership could also compromise the neutrality on which that role depends.

Research snapshot

Field Detail
Publication date 24 August 2026
Evidence cut-off 21 August 2026
Research type Flagship report + strategic acquisition analysis
Primary audience Family offices, venture/growth investors, lean investment teams and strategy leaders
Estimated reading time 30 minutes
Evidence boundary Purchase price, consideration, and private-company financials are not company-disclosed

Executive summary

Stripe’s agreement to acquire OpenRouter is the highest-salience AI-economy transaction of August because it moves the contest for value capture away from model leadership and toward the infrastructure that allocates inference demand. OpenRouter stands between applications and a changing supply of models and inference providers. It can route each request by cost, quality, latency, reliability and policy; normalize usage records; bill the customer; and settle with the supplier. Stripe already controls much of the downstream revenue stack. The transaction links both sides of AI gross margin.

The companies disclosed neither price nor consideration. Reuters cited Bloomberg at more than $7 billion. Axios reported more than $8 billion in cash and stock, later describing the mix as mostly stock with some cash. Those reports imply a value more than five times the $1.3 billion valuation Axios associated with OpenRouter’s May Series B, but they are not definitive transaction terms. The economic rights in a financing round and a control acquisition also differ. The correct conclusion is not that OpenRouter’s standalone value increased sixfold in 83 days; it is that Stripe appears willing to pay for strategic option value unavailable to a minority investor.

OpenRouter has genuine operating scale but incomplete financial disclosure. The company said weekly usage rose from 5 trillion to 25 trillion tokens in six months and that it was on pace to process more than one quadrillion tokens in 2026. Current pricing pages list more than 500 models and 80 providers. Pay-as-you-go customers pay a 5.5% platform fee; enterprise discounts and substantial free BYOK allowances make the effective take rate unknowable. The company has disclosed routed inference spend—not recognized revenue—at selected earlier dates. Without model mix, average model price, BYOK share, customer concentration, provider rebates, payment costs and gross margin, token volume cannot support a revenue estimate.

The strategic logic rests on four possible assets. Demand aggregation can create purchasing power and make OpenRouter a distribution channel for new models. Cross-provider metadata can improve reliability and selection. Unified billing and settlement can turn a gateway into a two-sided exchange. Stripe can also join the cost ledger to the revenue ledger, allowing AI applications to optimize contribution margin rather than token price alone. None of these advantages is automatic. Cloud platforms bundle routers into existing procurement; Portkey and LiteLLM offer enterprise and self-hosted alternatives; and independent research finds that sophisticated routers do not always outperform simple baselines.

The central underwriting question is therefore not whether multi-model routing will exist. It will. The question is whether a Stripe-owned OpenRouter can remain sufficiently neutral, technically differentiated and commercially valuable to become the default cross-provider control plane. The thesis strengthens with evidence of enterprise spend retention, durable effective fees, broad provider access, audited cost-quality gains and transparent governance. It weakens if routing becomes a free cloud feature, providers bypass the exchange, or customers conclude that a payment company should not observe both their revenue and inference-cost metadata.

Key findings

  • This is a control-point acquisition. Routing determines request-level cost, quality, latency, reliability and policy eligibility; joining it to billing makes the decision economically consequential.
  • The reported price is strategic, not yet financially underwritable. No recognized revenue, gross margin, retention, concentration or definitive transaction consideration has been disclosed.
  • OpenRouter’s defensibility is a system, not an algorithm: demand aggregation, provider access, normalized telemetry, settlement, enterprise controls and low-friction switching.
  • Stripe reduced integration risk by working with OpenRouter before the acquisition. Their January partnership already connected invoicing, tax, fraud and usage records to changing inference costs.
  • The Series B investor coalition was unusually strategic: NVIDIA, ServiceNow, MongoDB, Snowflake and Databricks invested alongside CapitalG and financial sponsors. That validates ecosystem relevance but also raises post-acquisition conflict questions.
  • Technical evidence is two-sided. Microsoft research demonstrates large benchmark savings from routing; LLMRouterBench finds several advanced and commercial routers fail to beat simple baselines reliably.
  • Neutrality is an economic asset. A perceived bias in rankings, routing or data use could reduce both provider participation and enterprise demand.
  • Cloud bundling is the most credible structural threat. Azure, AWS and Cloudflare can subsidize gateway functions with broader compute, network and procurement relationships.
  • The acquisition could shift industry power from model vendors toward demand aggregators. Providers gain distribution but lose some control over discovery, pricing and the customer relationship.
  • For investors, routed dollar spend, effective take rate, spend retention and measured outcome uplift matter more than developer accounts, model counts or raw tokens.

Contents

  • 1. Scope, evidence and selection rationale
  • 2. Transaction anatomy
  • 3. OpenRouter: company, founders and product
  • 4. Commercial model and unit-economics boundaries
  • 5. Financing history and investor coalition
  • 6. Stripe’s pre-existing position
  • 7. Market structure and competitive landscape
  • 8. What technical evidence says about routing
  • 9. Where a durable moat could reside
  • 10. Strategic value and valuation sensitivity
  • 11. Risks, counter-thesis and falsification
  • 12. First-, second- and third-order effects
  • 13. Scenarios
  • 14. What changed
  • 15. Implications for investors and strategy leaders
  • 16. Open questions and monitoring triggers

1. Scope, evidence and selection rationale

This report asks what the OpenRouter transaction reveals about value capture in a multi-model AI economy. The analysis covers the announced acquisition, company formation and financing, product architecture, disclosed pricing, privacy and governance, the investor coalition, Stripe’s adjacent assets, competing gateway models, independent routing research, and the conditions required for a defensible control point. It does not value Stripe, predict regulatory outcomes or present private-company metrics as audited data.

The topic was selected against four criteria: current market importance, investor relevance, structural implications and scope for differentiated analysis. Frontier-model releases attracted more public attention in parts of August, but their economic implications were less distinct and more likely to produce generic coverage. Stripe–OpenRouter combines a reported multibillion-dollar control transaction with a visible reorganization of the AI value chain: demand aggregation, cost optimization, usage accounting, revenue collection and supplier settlement.

Primary sources take precedence. Company announcements and technical documentation establish what Stripe, OpenRouter and competitors state about their products. Reuters and Axios are used only where the companies withheld transaction terms. Academic and industrial research is used to test the routing premise. Company-stated user, model, provider and token counts are dated and may not be comparable. Reported terms remain reported; analysis is labeled as interpretation or sensitivity.

EVIDENCE DISCIPLINE  No public source establishes OpenRouter’s recognized revenue, gross margin, net retention, customer concentration, provider concentration, or effective enterprise fee. This report therefore does not calculate an acquisition multiple or infer revenue from tokens.

2. Transaction anatomy

On 19 August, Stripe said it had agreed to acquire OpenRouter, a gateway and routing platform spanning more than 400 models from more than 80 providers. Stripe described request-level selection based on task complexity, price, speed and reliability and named NVIDIA, Zoom and Lovable as users. The announcement did not disclose the purchase price, form of consideration, retention package, closing conditions, regulatory process or expected completion date.[1]

Reuters reported that the value was undisclosed and cited Bloomberg at more than $7 billion.[2] Axios reported more than $8 billion in cash and stock and later said the consideration was mostly stock with some cash; Axios also said the transaction was expected to close within weeks.[3][4] These accounts establish a credible reported range, not a definitive price. Until contractual or regulatory evidence appears, the canonical treatment is $7 billion–$8 billion-plus reported value, terms undisclosed, agreement announced but not confirmed closed.

The timing is exceptional. OpenRouter announced a $113 million Series B on 28 May. Eighty-three days later, Stripe announced the acquisition. Axios associated the financing with a $1.3 billion valuation. At the midpoint of the reported acquisition range, the ratio to that financing value is roughly 5.8 times; at more than $8 billion, it exceeds 6.1 times. Those ratios are descriptive, not directly comparable multiples: a minority financing and a strategic acquisition price different rights, control, synergies, retention economics and consideration liquidity.

Exhibit 4. Company-building, financing and acquisition timeline

Source: OpenRouter; Stripe; Reuters; Axios; Solten & Co. chronology. Reported transaction values are not company disclosures.

3. OpenRouter: company, founders and product

OpenRouter was founded in 2023. Its 2025 financing release names Alex Atallah and Louis Vichy as founders; other company and investor materials also identify Chris Clark as a cofounder and operating leader. Atallah previously co-founded OpenSea and served as its CTO; his public biography also lists Stanford, Y Combinator, HF0 and Palantir. That background matters because OpenRouter resembles a marketplace as much as developer infrastructure: it aggregates fragmented supply, standardizes access, measures activity and clears payments.[7][12]

The product began as a single interface to multiple models. It has expanded into a production control layer with provider selection, failover, cost and latency optimization, policy-based routing, workspaces, budgets, guardrails, zero-data-retention controls, observability and multimodal access. The customer can use OpenRouter-funded credits or bring provider keys. Providers gain distribution and monthly settlement; developers avoid separate contracts and integrations; enterprises gain a common policy and accounting surface.[6][8][9]

OpenRouter’s data policy draws an important boundary. The company says it does not store prompts or responses unless a customer opts in. It does store request metadata such as token counts and latency to power reporting and rankings. That metadata is less sensitive than prompt content but economically valuable: it reveals model selection, price, reliability and switching patterns across a broad demand pool. Stripe ownership could make the combined dataset more useful while making governance more important.[10][11]

The company’s scale accelerated rapidly. In June 2025 it said annual run-rate inference spend had risen from $10 million in October 2024 to more than $100 million in May 2025 and that more than one million developers had used the API. By May 2026 it reported weekly volume rising from 5 trillion to 25 trillion tokens in six months, more than eight million developers and more than 400 models. Current pricing pages list more than 500 models and more than 80 providers. These are strong adoption signals, but none is a substitute for paying-customer cohorts or recognized revenue.[6][7][8]

Exhibit 1. The acquisition connects both sides of AI unit economics


Source: Stripe and OpenRouter product disclosures; Solten & Co. synthesis. Ownership does not establish completed integration or realized synergies.

4. Commercial model and unit-economics boundaries

OpenRouter has three commercial paths. Free users access a limited model and provider set. Pay-as-you-go users purchase credits and pay a 5.5% platform fee. Enterprise customers receive fee discounts, invoicing, higher BYOK allowances, contractual SLAs and support. On current pricing, PAYG customers can route $25,000 of list-price inference through their own provider keys each month without a fee and then pay 5%; enterprise customers receive a $200,000 allowance before the same stated fee.[8]

The headline fee is therefore not the effective take rate. Enterprise discounts reduce it; BYOK shifts underlying model cost away from OpenRouter; free allowances reduce monetized volume; provider incentives or credit economics are undisclosed. Payment processing, fraud losses, support, edge infrastructure, observability and reliability also consume gross profit. Conversely, demand aggregation may secure provider economics not visible on the list price. A complete underwriting model requires gross routed spend, BYOK share, recognized net revenue, provider rebates, payment costs and contribution margin by cohort.

Raw tokens are particularly misleading. A million tokens from a small open model and a million tokens from a premium reasoning model have different prices. Input, output, cached and reasoning tokens are priced differently. Workload mix changes over time. The same token volume can therefore represent very different routed spend. The most useful operating metric is gross routed inference spend, followed by effective take rate and gross profit; token volume is a capacity and engagement signal.

Metric What it indicates What it cannot establish
Token volume Workload scale and infrastructure demand Revenue without model and price mix
Developer accounts Top-of-funnel adoption Paying customers or retention
Model/provider count Breadth and switching options Traffic depth or contractual durability
Routed inference spend Dollar value of supply consumed Net revenue or margin
Effective take rate Monetization of routed spend Profit without provider/payment costs
Spend retention Cohort durability and expansion Margin quality without cost data

5. Financing history and investor coalition

OpenRouter disclosed a combined $40 million Seed and Series A in June 2025, led by Andreessen Horowitz and Menlo Ventures with participation from Sequoia and industry angels.[7] In May 2026 it announced a $113 million Series B led by CapitalG, with NVentures, ServiceNow Ventures, MongoDB Ventures, Snowflake Ventures, Databricks Ventures, AMP PBC and Pace Capital, alongside existing investors a16z and Menlo.[6] The disclosed rounds total $153 million. Axios reports $164 million raised; the $11 million difference is not reconciled by the public round announcements reviewed for this report and should remain an open data discrepancy.[3]

The Series B syndicate was strategically dense. NVIDIA represents compute and inference supply. ServiceNow represents enterprise workflows. MongoDB, Snowflake and Databricks sit in the data layer. CapitalG brings growth capital and an Alphabet relationship. Their participation suggests OpenRouter was useful across multiple parts of the enterprise AI stack. It may also have created commercial pathways and signaled that no single model or cloud would control all demand.

After a sale to Stripe, those relationships must be re-underwritten. Strategic investors may welcome faster distribution and billing integration, but they may resist a shift in routing incentives or data access. Their continued product partnerships, traffic commitments and board or information rights are not public. The investor coalition validates category importance; it does not guarantee post-acquisition alignment.

Investor group Strategic position Potential value to OpenRouter Post-deal question
CapitalG / a16z / Menlo / Pace Growth and venture capital Capital, recruiting, governance Return and retention terms
NVentures Compute and model ecosystem Supply access and distribution Routing neutrality across GPU/cloud supply
ServiceNow Ventures Enterprise workflow platform Production use cases and distribution Whether integrations deepen after Stripe
MongoDB / Snowflake / Databricks Data infrastructure Enterprise channels and workload context Data-plane conflicts and interoperability

6. Stripe’s pre-existing position

The acquisition did not begin from a cold start. In January 2026, Stripe and OpenRouter announced a commercial relationship under which OpenRouter used Stripe Invoicing, Tax, Radar and multiple payment methods. The companies said the integration tracked usage and billing so OpenRouter could adjust to changing model costs. Stripe also said every company on the Forbes AI 50 that monetized did so on Stripe.[5] The relationship gave Stripe operating visibility into the problem before it agreed to buy the company.

Stripe’s January acquisition of Metronome added a usage ledger for complex consumption pricing.[13] At Sessions in April, Stripe announced token-level streaming payments and other AI-economy tools.[14] Its 2025 update reported $1.9 trillion of payment volume across more than five million businesses and a $159 billion tender valuation; those figures describe Stripe’s overall platform, not the economics of OpenRouter.[15]

Together, the assets form a potential closed loop. An application earns revenue through Stripe; Metronome records usage; OpenRouter allocates inference supply; Stripe invoices the customer and pays providers. If those ledgers can be joined with customer permission, routing can optimize contribution margin rather than nominal token price. That is the acquisition’s most differentiated strategic option—and its most sensitive data-governance issue.

7. Market structure and competitive landscape

Model routing is not one market. It includes neutral model exchanges, managed enterprise gateways, cloud-native routers and self-hosted orchestration. OpenRouter combines model discovery, prepaid credits, routing and provider settlement. Azure and AWS route within their procurement and model catalogs. Cloudflare provides a multi-provider network gateway and charges 5% for unified billing while offering core gateway functions without an additional fee. Portkey and LiteLLM emphasize control, observability and self-hosting. Kong and other API platforms are extending existing gateway capabilities into AI.

The procurement boundary is decisive. A company already committed to Azure or AWS may prefer one security review, one bill and one support contract even if the model set is narrower. A regulated company may self-host its gateway. An AI-native application testing many new models may value OpenRouter’s breadth and provider settlement. The relevant market is therefore segmented by workload heterogeneity, governance requirements, cloud commitment and willingness to outsource routing logic.

Exhibit 5. Competitive structure of AI model routing and gateways

Source: vendor documentation; Solten & Co. classification. Feature breadth and pricing are point-in-time and not normalized for enterprise contracts.

Cloud bundling threatens fees more than functionality. A cloud provider can offer routing near zero incremental price because it earns on underlying compute. An independent exchange must either deliver broader access, better performance, stronger portability or superior settlement. OpenRouter’s 5.5% PAYG fee is material for high-spend workloads; its enterprise discount and BYOK structure show that price pressure already shapes the commercial model.

8. What technical evidence says about routing

The technical premise is sound but workload-dependent. Models have different strengths, prices and failure patterns, so an oracle that always selects the best model should outperform a single-model policy. The practical issue is whether a router can infer the right choice cheaply, quickly and consistently enough to capture that theoretical advantage.

Microsoft Research’s Switchcraft evaluated tool-calling across five function-calling benchmarks. The authors report 82.9% accuracy—matching or exceeding the best individual model—while reducing inference cost by 84%, or more than $3,600 per million queries.[23] This demonstrates that routing can create large savings in a bounded setting. It does not establish the same uplift for open-ended production workloads, changing model versions or an independent commercial router.

LLMRouterBench provides the essential counterweight. The ACL Findings paper evaluates more than 400,000 instances across 21 datasets, 33 models and 10 routing baselines. It confirms model complementarity but finds many routing methods perform similarly under unified evaluation; several recent approaches, including commercial routers, fail to reliably beat a simple baseline. The authors also identify a large gap to oracle selection and diminishing returns from larger model ensembles.[22]

The investment implication is precise: model breadth is not equivalent to routing advantage. OpenRouter must show that its production telemetry, provider-level reliability data, policy controls and continuous adaptation produce net customer value after fees and added latency. The right diligence evidence is workload-specific A/B testing against the customer’s own rule set, with quality, total cost, tail latency and failure recovery measured together.

9. Where a durable moat could reside

The API abstraction is copyable. The moat, if one forms, will come from reinforcing loops across demand, supply, data and settlement. More demand attracts providers and new model launches. More providers improve choice and resilience. More requests generate metadata on latency, price and reliability. Better allocation and easier billing attract more demand. Stripe could add distribution and financial infrastructure to that loop.

Each loop has a failure condition. Providers can multi-home or sell direct. Customers can export configurations to open-source gateways. Metadata may be insufficient to predict output quality. Enterprise procurement may favor a cloud vendor. Stripe’s ownership may weaken perceived neutrality. A strong moat therefore requires evidence of behavior, not feature count: increasing spend retention, low provider churn, improved route outcomes, rising share of wallet and the ability to sustain effective fees.

Moat candidate Evidence that would support it Evidence that would weaken it
Demand aggregation Routed spend and enterprise cohorts compound Traffic is promotional or highly concentrated
Supply liquidity Providers launch early and maintain capacity Key labs restrict access or price direct lower
Routing telemetry Measured uplift improves with scale Simple rules match production outcomes
Settlement Providers prefer one reconciliation layer BYOK dominates and exchange economics shrink
Enterprise controls High retention under policy constraints Customers self-host for governance
Stripe distribution Cross-sell lowers acquisition cost Bundling triggers neutrality concerns

10. Strategic value and valuation sensitivity

A conventional transaction multiple is unavailable. The reported price could reflect current economics, a control premium, founder and employee retention, competitive bidding, Stripe stock valuation, future cross-sell, defensive value or the option to shape agentic commerce. Without definitive terms, separating those components is impossible.

A sensitivity can still discipline the discussion. If a $7.5 billion illustrative value were supported by platform-fee revenue alone, the required routed spend would depend on the effective fee and revenue multiple. At a 5.5% fee and a 20-times revenue multiple, the implied routed spend is about $6.8 billion. At a 3% effective fee and a 10-times multiple, it is $25 billion. These are algebraic scenarios, not estimates; they exclude non-fee revenue, synergies, retention packages and margin differences.

Exhibit 3. Illustrative routed-spend sensitivity

Source: Solten & Co. sensitivity. Formula: value ÷ (revenue multiple × effective fee). Not an estimate of revenue, spend, price or fair value.

The sensitivity highlights the underwriting burden. A high strategic price can be rational if Stripe creates value across payments, billing and provider settlement or if OpenRouter becomes a durable exchange. It is difficult to justify from a thin fee on commodity routing. Investors should distinguish platform option value from demonstrated standalone economics.

11. Risks, counter-thesis and falsification

The strongest counter-thesis is that model routing becomes an abundant, low-cost feature rather than a durable profit pool. Clouds bundle it with compute; enterprises use open-source gateways; model prices converge; and simple policies capture most of the available savings. OpenRouter remains useful but cannot sustain a meaningful take rate. Stripe then owns an integration-heavy product whose neutrality is less credible and whose strategic value is largely defensive.

Neutrality risk is more immediate than antitrust scale. OpenRouter influences discovery, rankings and traffic allocation. Stripe has commercial relationships with model labs, applications and providers. Customers may ask whether routing optimizes their objective or the combined company’s economics. Providers may ask whether ranking, data or settlement terms favor selected partners. Transparent criteria, customer-controlled policies, auditable logs, data separation and equal access are product requirements.

Other risks include integration distraction, provider concentration, security and privacy failure, pricing compression, adverse model-policy changes, customer concentration and completion risk. A mostly-stock purchase reduces immediate cash use but exposes sellers to Stripe’s private-market liquidity and valuation. The retention arrangements are unknown; founder and engineering continuity matter because much of the asset is operational know-how and ecosystem trust.

Falsification test Thesis-negative observation Why it matters
Outcome advantage Rules-based routing matches cost-quality results Weakens data/algorithm moat
Enterprise retention Spend falls after initial model testing Suggests marketplace, not control plane
Provider access Major labs restrict or disadvantage OpenRouter Reduces breadth and exchange liquidity
Neutrality Customers demand separation or providers exit Ownership destroys a core asset
Fee durability Effective take rate compresses toward zero Routing becomes bundled infrastructure
Integration No measurable link to Stripe/Metronome economics Strategic premium remains unearned

12. First-, second- and third-order effects

First order: routing becomes a board-level unit-economics function

AI application companies will manage inference the way merchants manage payment acceptance: by workload, supplier, geography, reliability and margin. Model choice moves from an engineering default to a financial policy. The gateway gains influence over gross margin and service quality.

Second order: demand aggregation changes model distribution

New models may rely on gateways for discovery and production traffic. Large labs gain volume but become more comparable. Price and reliability data can reduce information asymmetry. Providers may respond with exclusivity, direct discounts, differentiated capacity or their own distribution channels.

Third order: financial infrastructure and compute allocation converge

If agents can buy tools and inference automatically, the system that authorizes spend, routes compute, meters consumption and settles suppliers becomes part of the transaction layer. Capital allocation can occur at the request level. The boundary between payments infrastructure, cloud brokerage and AI orchestration becomes less distinct.

The broader economic implication is that AI value capture may migrate toward coordination layers. Model producers still own intellectual property and compute suppliers still own scarce capacity, but an intermediary that aggregates demand and observes substitution can influence price discovery. The analogy is not a securities exchange: contracts, quality and supply are heterogeneous. It is closer to a programmatic procurement network with embedded billing.

13. Scenarios

Exhibit 6. Scenario map and evidence signposts

Source: Solten & Co. scenario framework. Scenarios are conditional paths, not probability-weighted forecasts.

Base case — independent control plane

OpenRouter remains broadly neutral, Stripe integrates billing and settlement gradually, and enterprise adoption grows among AI-native and multi-cloud workloads. Effective fees decline with scale but gross routed spend and spend retention offset compression. Cloud routers dominate captive workloads; OpenRouter wins where breadth, portability and new-model access matter.

Upside — AI economic network

Routing becomes a default layer for agentic applications. Cross-provider telemetry materially improves allocation; Stripe connects revenue and cost signals; and suppliers accept the network as a distribution and settlement channel. OpenRouter’s role expands from gateway to price-discovery and procurement infrastructure.

Downside — bundled routing wins

Cloud and open-source alternatives satisfy most enterprise needs. Providers offer direct economics that gateways cannot match. Routing performance converges toward simple baselines, while ownership weakens neutrality. OpenRouter remains a useful developer marketplace but the high strategic purchase price produces limited incremental return.

14. What changed

Before New evidence Updated interpretation
Routing looked like developer convenience Stripe agreed to a reported multibillion-dollar acquisition Routing is being priced as a strategic control point
OpenRouter was an independent neutral layer Ownership by a financial-infrastructure platform Neutrality becomes an explicit governance obligation
Stripe monetized AI applications downstream OpenRouter adds request-level supply allocation Stripe can potentially optimize both revenue and inference cost
Clouds and startups built separate gateways Category now includes exchange, cloud, network and self-hosted models Competitive analysis must segment procurement boundaries
Routing gains were often assumed Large benchmark shows inconsistent advantage over simple baselines Outcome evidence is required for underwriting

15. Implications for investors and strategy leaders

For Stripe and late-stage investors

The transaction is an option on AI economic infrastructure, not a disclosed earnings acquisition. Underwrite integration milestones, cross-sell, provider settlement, enterprise retention and neutrality. Demand a bridge from gross routed spend to net revenue and gross profit before using transaction multiples.

For AI application investors

Treat routing architecture as part of unit economics. Ask how model choice is made, whether outcomes are measured, who bears price changes, how fallback works and whether logic and data can be exported. A gateway can improve margin while creating a critical dependency.

For model and inference providers

Gateways can accelerate distribution and smooth settlement but make suppliers more comparable. Track gateway-sourced share, direct-versus-intermediated economics, ranking exposure, data access and the ability to preserve customer relationships.

For enterprise strategy teams

Separate gateway, router and marketplace requirements. Regulated workloads may prioritize self-hosting and policy. AI-native workloads may prioritize breadth and new-model access. Build an exit path: portable API contracts, retained observability data and an independent evaluation suite.

16. Open questions and monitoring triggers

Monitor Decision-relevant evidence
Definitive terms Price, stock/cash mix, retention packages, closing conditions and completion.
Revenue quality Recognized revenue, effective take rate, gross margin, spend retention and cohort expansion.
Concentration Share of routed spend by customer, provider, model and strategic investor relationship.
Routing outcomes Independent production evidence versus customer-specific rules and cloud-native routers.
Neutrality governance Ranking criteria, data separation, conflicts policy, auditability and customer control.
Provider behavior Departures, exclusivity, capacity restrictions, direct-only discounts or preferential launches.
Pricing Changes to PAYG fee, enterprise discounts, BYOK allowances and provider settlement.
Integration Concrete links among OpenRouter, Metronome, Billing, Radar, Connect and agentic commerce.
Competition Cloud or open-source alternatives reaching comparable breadth and outcome quality at lower cost.
Funding discrepancy Reconciliation of $153M disclosed rounds with Axios’s $164M total-raised figure.

The thesis should be upgraded only when operating evidence shows durable enterprise spend, measurable routing advantage and preserved neutrality. It should be downgraded if major providers restrict access, effective fees collapse without offsetting scale, enterprise cohorts fail to retain, or customers prefer cloud-native and self-hosted control planes.

Sources & evidence

Evidence cut-off: 21 August 2026. Access dates are the same unless noted. Company disclosures establish what was stated; they do not independently verify private-company revenue, customer quality or transaction value.

  1. Stripe agreement announcement, 19 Aug. 2026. Source
  2. Reuters: agreement confirmed; value undisclosed; Bloomberg reported >$7B, 19 Aug. 2026. Source
  3. Axios: >$8B cash-and-stock report and financing context, 17 Aug. 2026. Source
  4. Axios: mostly-stock consideration and Stripe first-half metrics, 19–20 Aug. 2026. Source
  5. Stripe–OpenRouter commercial partnership, 29 Jan. 2026. Source
  6. OpenRouter $113M Series B and operating metrics, 28 May 2026. Source
  7. OpenRouter combined $40M Seed and Series A disclosure, 25 Jun. 2025. Source
  8. OpenRouter pricing, accessed 21 Aug. 2026. Source
  9. OpenRouter provider network, accessed 21 Aug. 2026. Source
  10. OpenRouter data-collection policy, accessed 21 Aug. 2026. Source
  11. OpenRouter zero-data-retention policy, accessed 21 Aug. 2026. Source
  12. Alex Atallah biography, accessed 21 Aug. 2026. Source
  13. Stripe completes Metronome acquisition, 14 Jan. 2026. Source
  14. Stripe Sessions: AI-economy product launches, 29 Apr. 2026. Source
  15. Stripe 2025 update, 24 Feb. 2026. Source
  16. Microsoft Foundry model-router architecture, accessed 21 Aug. 2026. Source
  17. Amazon Bedrock intelligent prompt routing documentation. Source
  18. Cloudflare AI Gateway dynamic routing. Source
  19. Cloudflare AI Gateway pricing and unified billing. Source
  20. Portkey AI Gateway documentation, updated 3 Aug. 2026. Source
  21. LiteLLM documentation, accessed 21 Aug. 2026. Source
  22. LLMRouterBench, ACL Findings 2026. Source
  23. Microsoft Research Switchcraft, May 2026. Source

Methodological note

The report distinguishes disclosed facts, reported transaction terms, transparent calculations and Solten & Co. interpretations. Reported acquisition values are presented as a range because the companies disclosed no price. The $7.5 billion sensitivity midpoint is illustrative only. Product comparisons rely on vendor documentation and do not normalize negotiated contracts, SLAs, data residency or model quality. Academic and industrial benchmark results are scoped to their evaluation settings and are not claims about OpenRouter’s production performance.

The Price of Free Intelligence

Why China is opening its strongest AI models—and where the profits may move next.

SOLTEN & CO. RESEARCH  |  FLAGSHIP REPORT 

AI Models  /  Infrastructure  /  Cloud Economics  /  Capital Allocation

CENTRAL THESIS  Chinese laboratories are not giving intelligence away. They are reducing the price of model access to accelerate adoption, shape technical standards, and redirect demand toward paid inference, cloud infrastructure, enterprise products, and applications. The strategy is already economically visible at Alibaba, but it is not proven across the private labs—and it can be disrupted by serving cost, regulation, security concerns, or government restrictions.

Research snapshot

Field Detail
Publication date 31 August 2026
Evidence cut-off 21 August 2026
Research type Flagship thematic and market-structure report
Primary audience Family offices, venture/growth investors, lean investment teams and strategy leaders
Estimated reading time 30–35 minutes
Venture Deal Protocol Not applicable: this report does not underwrite a financing or acquisition
Core evidence boundary Public data measures releases, prices, downloads and one listed company’s segment economics; it does not reveal private-lab gross margins or production workload share

Executive summary

China’s leading AI laboratories are releasing model weights at a scale that would once have been treated as proprietary crown jewels. In August, Alibaba released weights for the 2.4-trillion-parameter Qwen3.8 flagship; Moonshot’s 2.8-trillion-parameter Kimi K3, DeepSeek V4, MiniMax M3 and Z.ai’s GLM family had already established a pattern. The immediate interpretation—China is giving away its best models for free—is memorable and incomplete. What is free is usually a licence to download weights. Training data, full reproducibility, reliable serving, compute, security, support and enterprise integration remain scarce or paid. Some licences also impose commercial conditions.[1]–[13]

The strategic logic is a substitution: sacrifice model-layer scarcity to acquire distribution. Open weights lower switching and experimentation costs, invite community optimisation, create derivatives and make a model family available through many clouds, gateways and on-premise stacks. That reach can stimulate demand for hosted APIs, cloud compute, accelerators, inference optimisation, security, evaluation and model-enabled applications. It can also influence which architectures and tooling conventions become defaults. Hugging Face counted 151,448 Qwen derivatives and roughly 180–210 new Qwen-based repositories per day during the first seven months of 2026. It simultaneously warned that Hub metrics are not commercial market share.[14]

Alibaba provides the clearest public evidence that the model can work. For the June 2026 quarter, its AI Cloud and Compute Services revenue rose 45% year over year to RMB48.4 billion and adjusted EBITA rose 133% to RMB5.6 billion. Alibaba also reported more than three billion Qwen downloads and more than 300,000 derivatives, while saying AI-related product revenue had delivered a twelfth consecutive quarter of triple-digit growth. Capital expenditure rose 75% to RMB67.7 billion. This is consistent with open models feeding a full-stack cloud business; it does not isolate Qwen’s causal contribution, and it shows that the strategy is capital intensive.[17], [18]

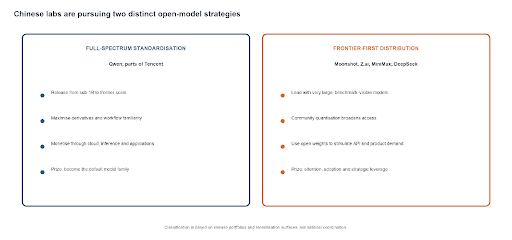
The strategy is not uniform. Qwen releases models across a broad size range, inviting developers to standardise on one family from local deployment to frontier workloads. Moonshot, Z.ai and MiniMax lead with very large models that few developers can serve directly; open weights create attention and distribution, but their paid APIs and subscriptions remain the practical product for many users. DeepSeek combines permissive MIT releases with official API prices far below U.S. frontier services. These are different business models, not evidence of a single centrally directed commercial plan.[4]–[14]

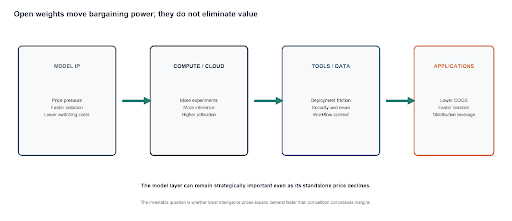
For investors, the consequence is a value migration rather than value destruction. Standalone model API pricing is under pressure. Compute demand, inference throughput and optimisation can expand. Enterprise control points—security, evaluation, observability, orchestration, proprietary data and workflow integration—become more important as model choice commoditises. Application companies can gain from lower variable cost, but only if competition does not pass the entire saving to customers. The most exposed companies are model vendors whose differentiation rests on generic capability and whose monetisation does not extend into cloud, distribution, proprietary data or workflow ownership.

The counter-thesis is substantial. The largest open models are expensive to serve: raw BF16 weight memory is approximately 4.8 terabytes for Qwen3.8’s 2.4 trillion parameters and 5.6 terabytes for Kimi K3’s 2.8 trillion, before runtime overhead. Download counts can reflect curiosity, mirrors or automated pipelines rather than durable production. Security review, censorship behaviour, licensing ambiguity and geopolitical restrictions can block enterprise adoption. Reuters reported that Chinese authorities had discussed possible limits on overseas access to advanced models; no policy decision had been confirmed at the evidence cut-off.[2], [4], [14], [26]

Our conclusion is conditional but decisive: the topic merits fundamental coverage because open-weight competition changes the price of intelligence, the geography of standards and the profit pools around AI. The investable signal is not another benchmark victory. It is whether open-model distribution converts into paid inference, cloud utilisation, enterprise deployments and application gross profit without destroying the margins needed to fund the next generation.

Key findings

  • ‘Free’ is a distribution choice, not a cost structure. Most releases provide weights; they do not provide training data, full reproducibility, serving or enterprise assurance.
  • China is not a single actor. Qwen’s full-spectrum strategy aims at developer standardisation; frontier-first labs use open releases as demand generation, credibility and ecosystem leverage.
  • The strongest monetisation evidence is Alibaba’s cloud segment. It supports the mechanism but does not prove that every private lab can reproduce it.
  • Open-model adoption is real but poorly measured. Derivatives and downloads indicate ecosystem activity; they do not reveal production workloads, routed dollars, retention or gross margin.
  • Licences are becoming a strategic variable. DeepSeek and GLM use MIT for major releases, while Qwen3.8 and MiniMax M3 use custom terms that can limit or condition commercial use.
  • Frontier API prices span orders of magnitude. DeepSeek V4 Pro lists $0.435 per million uncached input tokens and $0.87 output; OpenAI GPT-5.6 Sol lists $5 and $30; Anthropic Claude Fable 5 lists $10 and $50. Capability, latency, support and safety are not normalised.
  • Open weights benefit cloud and hardware only if lower prices expand workload volume faster than unit margins compress. Capex and power remain unavoidable.
  • The model layer can retain strategic value even if direct licensing value falls: model defaults influence toolchains, hardware optimisation, application design and standards.
  • The largest threats are regulatory bifurcation, security concerns, serving economics, custom licence friction and a renewed capability gap in favour of closed models.
  • The decisive 12–24 month indicators are production spend, enterprise deployments, paid API mix, cloud segment economics, independent capability-per-dollar, and any export or access restrictions.

Contents

Sections 1–8 Sections 9–15
1. What is actually being given away 9. Value migration across the AI stack
2. The August 2026 release wave 10. Industrial-policy and geopolitical logic
3. Two open-model strategies 11. Counter-thesis and falsification
4. The economics of distribution 12. Scenarios for 2027–2029
5. Evidence that monetisation is occurring 13. Investor implications
6. Pricing pressure and deployment reality 14. Open questions and monitoring triggers
7. Adoption: strong signal, weak instrument 15. Conclusion
8. Licences, openness and control Methodology, limitations and sources

1. What is actually being given away

The phrase ‘open source’ conceals several different bundles. A fully reproducible system would disclose weights, architecture, inference code, training code, data provenance and a licence permitting modification and redistribution. Most frontier releases provide weights, architecture descriptions and enough code to run inference. They do not disclose the complete training corpus or a recipe that lets a third party recreate the model. The more precise term is open weight.[24], [25]

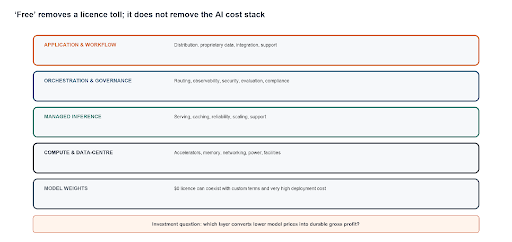
That distinction is economically important. A developer may avoid a per-token licence toll by downloading the weights, but still needs storage, accelerators, high-bandwidth memory, networking, serving software, optimisation, monitoring, security and people. For very large mixture-of-experts models, only part of the parameter set is active for each token, reducing compute relative to a dense model. The full weight set must nevertheless be stored and made available to the serving system. Quantisation can reduce memory; runtime state, redundancy and the key-value cache add it back.

Exhibit 1. The cost stack behind a free model

Source: Solten & Co. framework. A zero licence price does not imply zero total cost of ownership.

Model Total / active parameters Approx. raw BF16 weight memory Release / licence boundary
Qwen3.8-2.4T-A95B 2.4T / 95B 4.8 TB Weights released; custom Qwen3.8-Max licence
Kimi K3 2.8T / vendor-disclosed MoE 5.6 TB Weights released; custom terms
DeepSeek V4 Pro 1.6T / 49B 3.2 TB Official open weights; MIT
GLM-5.2 744B MoE 1.49 TB Weights released; MIT
MiniMax M3 ~428B / ~23B 0.86 TB Weights released; custom community licence

Memory figures are arithmetic: parameter count multiplied by two bytes, expressed in decimal terabytes. They exclude quantisation, runtime overhead, cache, redundancy and multimodal components. They are deployment-scale illustrations, not hardware bills.[2], [4], [6], [9], [12]

2. The August 2026 release wave

Alibaba’s August release brought the argument into focus. Qwen3.8-Max launched first as a managed multimodal model. The company then released a 2.4-trillion-parameter, 95-billion-active text checkpoint on 12 August and a 27-billion-parameter model on 14 August. It was the first open release at Alibaba’s Qwen-Max scale. The open checkpoint and managed service are related but not identical: the hosted product adds vision, longer default context and integrated tools.[1]–[3]

The surrounding market makes the release structural rather than episodic. Moonshot introduced Kimi K3 in July with 2.8 trillion parameters and a one-million-token context window, distributed through weights, a consumer product, Kimi Code, Kimi Work, enterprise subscriptions and a paid API. Z.ai released GLM-5.2 under MIT in June and announced GLM-5.3 in August, with weights scheduled after additional safety work. DeepSeek’s V4 family combines a 284-billion-class Flash model and a 1.6-trillion-parameter Pro model under MIT. MiniMax M3 provides a 428-billion-parameter multimodal model under a custom community licence.[4]–[13]

Family Latest relevant release Open-weight status Paid surface Investor-relevant caveat
Qwen Qwen3.8 Max / 2.4T-A95B Released; custom licence Alibaba Cloud, QwenWork, apps Strongest public cloud monetisation anchor
Kimi K3, 2.8T Released; custom terms API, subscriptions, enterprise Serving scale makes hosted access practical
DeepSeek V4 Flash / Pro Released; MIT Official API Extremely low list price; private economics undisclosed
Z.ai GLM-5.2 / 5.3 5.2 MIT; 5.3 promised API, coding plans Release timing and product version can diverge
MiniMax M3, ~428B Released; custom licence API, agent and subscriptions Commercial authorisation threshold in licence

Vendor evaluations show these models close to the frontier on selected coding, agentic and long-context tasks, but no model is uniformly best. Harnesses, reasoning budgets, hardware, prompts and task mix differ. We use benchmarks to establish that the releases are strategically credible, not to crown a global winner.[2]–[7], [30]

3. Two open-model strategies

The release portfolios reveal two strategies. Qwen and parts of Tencent cover the full range from small local models to frontier systems. That lets a developer learn one family, fine-tune it, deploy a small version on-device and move to hosted frontier inference without changing the conceptual stack. The commercial prize is standardisation. Hugging Face reports that Qwen’s 2026 portfolio generated roughly 2.05 billion downloads across repositories with declared parameter counts—about 55 times Moonshot’s frontier-only portfolio—and 151,448 derivatives.[14]

Moonshot, Z.ai and MiniMax publish far less below 70 billion parameters. Their largest models are too expensive for most developers to serve directly, so the open release works as proof, distribution and a community-optimisation seed. Quantised variants appear quickly; third-party inference providers add access; the laboratory sells an official API, coding plan, consumer subscription or enterprise service. DeepSeek sits between the categories: its permissive releases achieve enormous distribution, while its official API is priced aggressively enough to compete with self-hosting for many workloads.[4]–[14]

Exhibit 2. Two different routes from openness to economic value

Source: Hugging Face release-portfolio analysis; company product disclosures; Solten & Co. classification.

This diversity matters for underwriting. Alibaba can subsidise model R&D with e-commerce cash flow and monetise through a large cloud. A venture-backed laboratory must turn attention into paid inference, subscriptions, enterprise contracts or strategic financing before cash runs out. The same open-weight tactic therefore has different runway, pricing and bargaining implications across firms.

4. The economics of distribution

Opening weights changes the customer-acquisition equation. A closed API asks developers to trust one vendor’s economics, availability and roadmap. An open model can be downloaded, inspected, fine-tuned, mirrored, quantised and offered by competing hosts. Each new deployment becomes a distribution endpoint the originating lab did not have to finance. Derivatives add languages, domains, formats and hardware targets. The community absorbs part of the optimisation expense.

The return can arrive through five channels. First, a laboratory can sell an official managed API to users who prefer reliability to self-hosting. Second, a cloud provider can monetise storage, accelerators, networking and inference. Third, the model can pull users into an application or subscription. Fourth, broad adoption can influence libraries, evaluation conventions and hardware optimisation. Fifth, ecosystem position can improve financing and strategic bargaining power even before operating profit appears.[14], [19], [20]

The strategy resembles loss-leader economics but with an important difference: model weights are non-rival digital assets. Once released, the marginal distribution cost is low, but the strategic concession is irreversible. Competitors can study, modify and serve the model; the originator cannot later restore exclusivity. The bet is that adoption, iteration and complementary revenue exceed the lost option value of keeping the model closed.

Concession Expected return Evidence available Evidence still missing
Zero / low licence price Faster adoption and derivatives Downloads, repositories, provider listings Production share and customer retention
Replicable serving Broader distribution Third-party hosts and quantisations Originator’s paid share of demand
Community modification Faster optimisation and localisation Derivative models and ports Value captured by the original lab
Benchmark visibility API and subscription demand Launch traffic and price pages Cohort conversion and gross margin
Hardware compatibility Cloud / chip utilisation Vendor integrations Incremental revenue attributable to model

5. Evidence that monetisation is occurring

Alibaba is the observable case. The company’s June-quarter release reports RMB48.437 billion of AI Cloud and Compute Services revenue, up 45% year over year, and RMB5.628 billion of adjusted EBITA, up 133%. The implied adjusted EBITA margin was approximately 11.6%. AI-related product revenue reached RMB12.38 billion and continued triple-digit growth for a twelfth consecutive quarter. The company reported RMB67.7 billion of quarterly capital expenditure, up 75%.[17], [18]

Management explicitly describes the full-stack logic: open Qwen models create reach; training, development and inference run on Alibaba Cloud; the company also supplies chips, servers, storage, networking and applications. Qwen had more than three billion company-stated downloads and more than 300,000 derivative models by the earnings date. That is consistent with a distribution flywheel.[17], [19], [20]

WHAT THE ALIBABA EVIDENCE PROVES—AND WHAT IT DOES NOT  It proves that a company pursuing open-model distribution can simultaneously grow a large, increasingly profitable cloud segment. It does not prove that Qwen caused the growth, that every Qwen deployment runs on Alibaba Cloud, or that a standalone model laboratory can fund the same strategy.

The private-lab evidence is thinner. Kimi sells token-based API access and tiered consumer subscriptions; Z.ai sells API access and coding plans; DeepSeek operates an aggressively priced API; MiniMax sells APIs and applications. These paid surfaces refute the claim that the companies reject monetisation. Public sources do not establish revenue mix, inference gross margin, retention, subsidy levels or the share of open-weight users that convert to paid services.[4], [5], [8], [11]–[13]

Capital formation is a second, weaker form of evidence. Ecosystem traction supports valuations and access to strategic partners. It is not evidence of durable unit economics. For investors, the distinction between financing validation and customer validation is essential.

6. Pricing pressure and deployment reality

Official list prices show how aggressively Chinese providers can attack the hosted layer. DeepSeek V4 Pro lists $0.435 per million uncached input tokens and $0.87 per million output tokens. Z.ai lists GLM-5 at $1 and $3.20. Kimi K3 lists $3 and $15. OpenAI lists GPT-5.6 Sol at $5 and $30, while Anthropic lists Claude Fable 5 at $10 and $50. Qwen3.8-Max’s international Model Studio price is CNY14.988 for input and CNY44.965 for output.[5], [8], [11], [21]–[23]

Managed model Uncached input / 1M Output / 1M Context Boundary
DeepSeek V4 Pro $0.435 $0.87 1M Official list; capability and service levels not normalised
Z.ai GLM-5 $1.00 $3.20 200K Current developer price; GLM-5.3 price not yet listed
Kimi K3 $3.00 $15.00 ~1M Cache-hit input is $0.30
OpenAI GPT-5.6 Sol $5.00 $30.00 ~1.05M Short-context standard list price
Anthropic Claude Fable 5 $10.00 $50.00 Vendor service Global API list price
Qwen3.8-Max intl. CNY14.988 CNY44.965 1M Currency intentionally not converted

On list price alone, DeepSeek V4 Pro is about 11.5 times cheaper than GPT-5.6 Sol on uncached input and 34.5 times cheaper on output. The comparison is illustrative, not a price-performance verdict. Models differ in quality, tokenisation, reasoning-token consumption, latency, uptime, safety, data handling, regional availability and support. Enterprise contracts can also diverge materially from list price.[11], [22]

Self-hosting is not automatically cheaper. The economic choice depends on utilisation. A fully provisioned cluster can be attractive at sustained volume, strict data-sovereignty requirements or specialised optimisation. At low or bursty volume, managed inference converts fixed capacity into variable cost and absorbs reliability engineering. Open weights expand the option set; they do not make every customer a cloud operator.

7. Adoption: strong signal, weak instrument

The evidence for ecosystem reach is unusually strong. Hugging Face reports Chinese frontier models exceeding U.S. open releases in scale in almost every month of 2026. Qwen-based repositories reached 151,448 derivatives, and Qwen added roughly 180–210 derivatives per day in the first seven months. The ATOM Project reports Qwen rising from about 1% of new fine-tunes and adaptations in January 2024 to 69% in February 2026. AP reported that the five most-used models on OpenRouter over a recent month were Chinese and that Kimi consumer downloads accelerated after K3.[14]–[16]

The same evidence contains its own warning. Hugging Face found that 85.6% of model repositories had fewer than 200 lifetime downloads and that 1.5% of repositories accounted for 99.2% of downloads. Only one repository appeared in both the year’s top-25 lists by downloads and likes. Small models below one billion parameters accounted for 83% of all-time downloads among repositories declaring size; models above 100 billion accounted for 1%. Attention, adoption and production are different variables.[14]

Downloads can be triggered by mirrors, automated pipelines and repeated environments. API usage omits private deployments; private deployments omit hosted APIs. Derivatives count experimentation and ecosystem labour, but not users or revenue. OpenRouter token shares are provider-specific and can shift with price promotions. A credible market-share measure would combine routed spend, production tokens, active deployments, renewal and workload criticality. No public dataset does this comprehensively.

Metric Useful for Unsafe inference
Downloads Distribution and pipeline activity Commercial share or unique users
Likes / launch traffic Attention and developer interest Durable adoption
Derivatives Community investment and standardisation Originator revenue
Router token share Hosted workload momentum All deployment channels
API list price Competitive posture Realised price or gross margin
Named enterprise deployments Production credibility Portfolio-wide penetration

8. Licences, openness and control

Licensing is becoming a monetisation surface rather than a footnote. Hugging Face found that 59% of 178 Chinese releases above 20 billion parameters in 2026 used Apache 2.0 and 22% used MIT. DeepSeek and Z.ai released major frontier models under MIT. The latest largest releases are less uniform: Qwen3.8 uses a custom licence, and MiniMax M3 requires attribution for commercial use and prior written authorisation above a $20 million annual-revenue threshold.[2], [6], [9], [13], [14]

This makes ‘free’ conditional. A company may be able to test, modify and deploy without paying the lab, yet still face attribution, usage, revenue or geographic terms. Licences can change between generations. The practical switching cost is therefore not only technical compatibility; it includes legal review and the risk that a future flagship has different conditions.

Control also survives outside the licence. The laboratory chooses release timing, safety tuning, documentation, tokenizer and architecture. The hosted version can include tools, multimodality, longer context, faster inference and support not present in the checkpoint. A lab can open yesterday’s weights while monetising today’s integrated product.

9. Value migration across the AI stack

Exhibit 3. Where value can move as model access gets cheaper

Source: Solten & Co. value-chain framework.

Model commoditisation is not binary. Frontier capability can retain a premium while adequate capability becomes abundant. Most enterprise tasks have a threshold: once accuracy, reliability and latency are sufficient, cost, data control and integration dominate. Open models accelerate competition below the absolute frontier and make model substitution easier. This pressures generic API margins and increases the value of routing, evaluation and proprietary workflow context.

Compute and cloud can benefit through an elasticity effect. Lower prices stimulate experiments, longer contexts, more agentic steps and more users. If token demand rises faster than unit prices fall, total inference revenue grows. Hardware vendors also use open models to demonstrate and optimise their systems. Hugging Face notes that NVIDIA and AMD were the most prolific U.S. model publishers in 2026 and interprets the releases as a route to chip demand.[14]

Tools and applications face a more selective outcome. Gateways, observability, security, evaluation and optimisation become valuable because model choice multiplies operational complexity. Application companies benefit if lower inference cost improves contribution margin or enables new usage. They lose the advantage if every competitor accesses the same models and passes savings to customers. Distribution, proprietary data and workflow ownership—not model access alone—determine who keeps the surplus.

Layer Likely first-order effect What creates durable value Principal risk
Frontier model APIs Price pressure below the top capability tier Unique capability, trust, distribution Adequate open substitutes
Cloud / inference Higher workload volume Utilisation, cost curve, capacity Capex and price competition
Chips / systems More serving demand and optimisation Performance per watt and ecosystem Domestic substitution / export controls
Deployment tooling More complexity and choice Workflow data, governance, switching Cloud bundling
Applications Lower variable cost Distribution and proprietary context Savings competed away

10. Industrial-policy and geopolitical logic

Open models also serve an industrial strategy. The U.S.-China Economic and Security Review Commission argues that low-cost, open-weight deployment can create two feedback loops: a digital loop of adoption and iteration and a physical loop in manufacturing, robotics and research that generates specialised real-world data. The paper treats China’s compute constraints, state support and industrial base as reinforcing conditions. It is a policy analysis, not neutral proof of commercial causality.[24]

Stanford HAI’s review is useful because it resists a monolithic account. Chinese firms vary in licence, architecture, target users and relationship to the state. Export controls may have encouraged efficiency and openness, but academic work finding association between U.S. policy and developer engagement does not establish a clean counterfactual. The observed ecosystem is the product of company strategy, capital constraints, cloud economics, policy support and developer demand.[25], [28]

Standards influence may be the largest long-duration prize. A widely fine-tuned model shapes toolchains, file formats, inference kernels, evaluation practice and developer skills. Hardware vendors optimise around it; universities teach it; applications inherit its behaviours. Those complements can persist even when another model wins the next benchmark.

Geopolitics can reverse the distribution advantage. Reuters reported in July that Chinese authorities had discussed restricting overseas access to advanced models, including open and closed systems; the scope was undecided and ministries and companies did not confirm the discussions. U.S. policymakers have also debated restrictions on Chinese models. A bifurcated market would reduce global scale but increase demand for sovereign hosting, regional clouds and compliance tooling.[26], [27]

11. Counter-thesis and falsification

A strong thesis must specify what would make it wrong. The first possibility is that open-model activity is mostly attention. Downloads and derivatives may fail to convert into production workloads, paid APIs or enterprise renewal. The second is that serving cost overwhelms the distribution benefit: very large checkpoints remain impractical outside specialist hosts, and official APIs price below sustainable economics. The third is that closed labs preserve a large capability or reliability gap and can continue charging a premium.

The fourth failure mode is institutional. Security teams may reject Chinese models because of data governance, supply-chain review, content behaviour or policy uncertainty. Custom licences may deter commercial use. China may limit overseas access, or the United States and allies may restrict procurement and distribution. The fifth is competitive: clouds and hardware vendors can adopt open models while capturing most of the economics, leaving the originating lab with little more than brand awareness.

Thesis claim Falsification test Observable evidence
Open releases drive economic demand Production spend and renewal do not follow ecosystem activity API revenue, routed spend, named renewals
Value migrates to cloud / inference Cloud AI growth or margins fail despite model adoption Segment revenue, EBITA, utilisation, capex
Open models compress premium pricing Closed APIs retain share and pricing at adequate workloads Price changes, router mix, enterprise contracts
Standards create durable influence Derivative and toolchain growth shifts away from Qwen Repository creation, framework defaults, integrations
Global distribution compounds Regulation or security blocks cross-border production use Procurement bans, export limits, provider delistings
Self-hosting is a credible option Total cost remains consistently above managed APIs Independent TCO studies and utilisation data

12. Scenarios for 2027–2029

Exhibit 4. Scenario map

Source: Solten & Co. scenario framework. Not a forecast.

In the open-substrate scenario, enterprises treat models as interchangeable components. Open families become default starting points; premium closed models are invoked only when incremental capability justifies cost. Model API prices compress, but inference volumes expand. Full-stack clouds, efficient hardware, deployment tooling and well-distributed applications capture the value.

In the bifurcated-stacks scenario, trust, regulation and supply chains separate markets. Chinese open models dominate parts of Asia, the Global South and private deployment; Western closed models retain regulated and high-trust workloads in the United States and allied markets. Sovereign hosting, localisation and compliance become larger profit pools. Standards split rather than converge.

In the constrained-diffusion scenario, large open models remain influential research and specialist assets but do not become the default production substrate. Serving cost, security reviews and access controls slow adoption. Managed inference reconcentrates demand, and closed frontier vendors preserve pricing power. The scenario is more likely if independent benchmarks show a widening capability gap or if official restrictions disrupt model availability.

13. Investor implications

For public-market investors, Alibaba is the cleanest live experiment. The relevant question is not whether Qwen wins benchmarks but whether AI-related cloud revenue, external customer growth and adjusted EBITA outpace capex and depreciation over a full cycle. The June quarter is encouraging: growth accelerated and segment profit expanded despite investment. One quarter cannot establish returns on invested capital.[17], [18]

For venture and growth investors, a model laboratory without cloud ownership needs a credible conversion surface. API revenue, enterprise subscriptions, consumer products, proprietary data or strategic distribution must fund training and serving. Downloads are a lead indicator at best. Diligence should prioritise realised price, inference contribution margin, paid conversion, retention, workload criticality, compute commitments and licence obligations.

For infrastructure investments, demand elasticity is decisive. Lower model prices can expand token volume, context length and agentic workloads, benefiting compute, memory, networking, power and cooling. It can also intensify price competition and strand inefficient capacity. Underwriting should be based on contracted utilisation, performance per watt, customer concentration and the ability to support multiple model families.

For software investors, lower inference cost is not automatically a moat. It can improve gross margin temporarily, then be competed away. Durable beneficiaries combine AI with distribution, proprietary workflow data, high switching costs or a control point such as security, evaluation or orchestration. A product whose only advantage is access to a strong model is increasingly fragile.

Diligence scorecard

Question Strong evidence Weak evidence
Is adoption commercial? Paid production spend, renewal, critical workloads Downloads, likes, launch traffic
Is pricing sustainable? Contribution margin after serving and support Low list price without cost disclosure
Is the ecosystem defensible? Derivatives plus tools, hardware and enterprise integrations A single benchmark lead
Can the company fund the cycle? Cash runway, cloud subsidy or contracted capacity Strategic valuation alone
Can customers deploy safely? Audits, governance, licence clarity, regional hosting Open weights alone
Who captures lower cost? Retained application margin or higher usage Gross-cost decline with no pricing power

14. Open questions and monitoring triggers

Open questions

  • What share of Qwen, Kimi, DeepSeek, GLM and MiniMax usage is paid production rather than evaluation or community activity?
  • What are realised API prices, inference gross margins and compute subsidies by laboratory?
  • How much of Alibaba Cloud’s AI growth is attributable to Qwen-led workloads rather than general compute demand?
  • Which open-model derivatives are used in regulated enterprise production outside China?
  • How will custom licences evolve as the largest models become more expensive to train?
  • Do Chinese open models retain capability-per-dollar leadership under independent, task-specific evaluation?
  • What security, censorship and data-governance behaviours emerge across self-hosted and managed routes?
  • Will Chinese or Western governments restrict model-weight distribution, procurement or cloud access?
  • Does community optimisation create value for the originating lab or primarily for third-party clouds and hosts?
  • At what utilisation and configuration does self-hosting beat managed inference on total cost and reliability?

Monitoring triggers

Signal Frequency Thesis strengthens if Thesis weakens if
Qwen derivatives and established downloads Monthly Growth persists beyond launch cohorts Activity decays or shifts to another family
Router token and dollar share Monthly Chinese models gain paid production spend Share is promotion-driven or transient
Alibaba AI Cloud revenue / EBITA / capex Quarterly Profit grows with utilisation Capex rises without durable margin
Official API prices Monthly Volume expands without destructive repricing Repeated cuts imply unsustainable competition
Independent capability-per-dollar Per release Open models remain adequate for enterprise tasks Closed frontier gap widens materially
Licences and weight availability Per release Commercial terms remain usable Restrictions and revenue conditions broaden
Named enterprise deployments Quarterly Renewed, regulated workloads appear Pilots fail to reach production
China / U.S. policy Event-driven Cross-border access remains open Export, procurement or hosting limits expand
Hardware and cloud integrations Monthly More optimised, multi-provider serving Availability narrows to captive stacks

15. Conclusion

China’s strongest open-weight releases are not acts of commercial surrender. They are bids to make model intelligence abundant enough that distribution, infrastructure and ecosystem position become the scarce assets. The model works most clearly for a full-stack company such as Alibaba, which can monetise compute, cloud services, chips and applications around Qwen. It is more speculative for independent laboratories that must finance frontier training while competing on API price.

The strategy matters beyond the laboratories themselves. It lowers the reservation price for adequate intelligence, weakens model exclusivity, accelerates multi-model deployment and raises the value of compute efficiency, governance, proprietary data and application distribution. It also exports architectural choices and developer habits. Those structural effects can persist even if a Chinese model never holds the absolute benchmark lead.

The correct investment stance is neither ‘open source wins’ nor ‘closed models win.’ It is to follow the conversion from reach to economics. The winning companies will be those that turn cheaper intelligence into paid throughput, durable workflows and attractive returns on capital. Downloads are evidence of movement. Revenue, retention, margin and standards are evidence of power.

Methodology and limitations

This report triangulates official model cards, licences, API price pages, listed-company disclosures, platform adoption data, policy research, academic work and high-quality reporting. Primary sources establish release facts, stated prices and company-reported metrics. Vendor benchmarks are not normalised and are not used as definitive rankings. Computed figures show formulas and boundaries. Reported policy discussions are not treated as enacted policy.

The evidence base is strongest on what was released, under which licence, at what list price, and on Alibaba’s segment results. It is weaker on private-company economics, causality between open releases and cloud revenue, production market share, enterprise security outcomes and total cost of self-hosting. Conclusions in those areas are explicitly conditional.

Sources & evidence

Evidence cut-off: 21 August 2026. Access dates are the same unless otherwise noted. Vendor benchmark and adoption claims are attributed; they are not treated as independent verification. Adjacent references are separated as [10], [11] for legibility.

  1. Qwen3.8 official release repository and release log. Source
  2. Qwen3.8-2.4T-A95B official model card and license. Source
  3. Alibaba Cloud: Qwen3.8-Max launch announcement, 3 Aug. 2026. Source
  4. Moonshot AI: Kimi K3 launch, architecture, evaluations and API pricing. Source
  5. Kimi K3 official pricing page. Source
  6. Z.ai: GLM-5.2 official release. Source
  7. Z.ai: GLM-5.3 official release. Source
  8. Z.ai developer pricing. Source
  9. DeepSeek official Hugging Face model catalogue. Source
  10. DeepSeek-V4 official collection. Source
  11. DeepSeek API models and pricing. Source
  12. MiniMax-M3 official model card. Source
  13. MiniMax-M3 community license. Source
  14. Hugging Face: State of Open Models — Summer 2026. Source
  15. ATOM Project report on open-model adoption. Source
  16. Associated Press: Chinese-model consumer and router adoption, July 2026. Source
  17. Alibaba Group June-quarter 2026 results. Source
  18. Alibaba Group June-quarter 2026 results, exchange-hosted copy. Source
  19. Alibaba Cloud: Joe Tsai on open-source monetization. Source
  20. Alibaba Cloud full-stack AI roadmap and RMB380bn investment plan. Source
  21. Alibaba Cloud Model Studio token pricing. Source
  22. OpenAI official API pricing. Source
  23. Anthropic: Claude Fable 5 availability and pricing. Source
  24. U.S.-China Economic and Security Review Commission: Two Loops. Source
  25. Stanford HAI/DigiChina: China’s diverse open-weight ecosystem. Source
  26. Reuters: reported discussions about possible Chinese restrictions on overseas access. Source
  27. China NDRC: action plan on global AI cooperation. Source
  28. ArXiv: U.S. policies and China’s open-AI ecosystem. Source
  29. ArXiv: Use of Chinese open-weight models in scientific research. Source
  30. ArXiv: Chinese open models on financial-language tasks. Source
  31. Z.ai GLM-5.2 official Hugging Face model repository. Source
  32. MiniMax investor-relations release index. Source

The Grid Is the New GPU

Why energization rights, interconnection capacity and firm power are becoming strategic assets in the AI economy.

Solten & Co. Research Report
Published/updated: August 20, 2026
Research universe: AI Infrastructure / Energy / Data Centers / Capital & Deals

Research Snapshot

Research type: Flagship Research Report 

Evidence cut-off: August 20, 2026

Estimated reading time: ~30 minutes

Executive Summary

The AI infrastructure race is moving into a new phase. For the past several years, the scarcest strategic inputs were advanced accelerators, high-bandwidth memory, networking equipment and the capital required to buy them. Those constraints have not disappeared. But a more physical bottleneck is moving upstream: the ability to energize a data center at the scale and on the timetable that AI developers now require.

The change is visible in the numbers. Lawrence Berkeley National Laboratory’s June 2026 update estimates that U.S. data centers could consume 11.8% of total U.S. electricity in 2030 in its reference case, with sensitivity scenarios ranging from 9.5% to 15.3%. The same report estimates roughly 148 GW of interconnection capacity could be required for data centers by 2030 under a 50% average utilization assumption. AI servers are the dominant driver of the increase.

That load is arriving much faster than the infrastructure built to serve it. An advanced data center can be developed in roughly two to three years, while Berkeley Lab’s latest national interconnection analysis shows that the median path from a generation interconnection request to commercial operation now exceeds five years in the regions with available data. The result is a structural timing mismatch: compute capital can be committed faster than reliable power can be connected.

This changes what “capacity” means in AI infrastructure. A site with land, fiber and a data-center shell is not necessarily a usable AI asset. The economically scarce object is increasingly an energization right: a credible path to a specific quantity of power, at a specific location, by a specific date, with acceptable reliability, cost and curtailment terms. In markets where grid capacity is tight, queue position, executed utility agreements, transmission access and generation arrangements can become as strategically important as the servers themselves.

Virginia offers a revealing leading indicator. Dominion Energy says it has assigned energization dates through 2031 to 25 GW of new data-center projects for which it has current or soon-to-be-connected capacity. Another 45 GW of proposed new data-center projects do not yet have future connection dates. At the same time, the Virginia State Corporation Commission has created a separate large-load rate class that includes long-term minimum obligations, minimum monthly transmission and distribution charges, and potential collateral requirements. The power contract is beginning to resemble an infrastructure commitment rather than a simple utility bill.

Grid operators are adapting as well. PJM spent 2025–2026 developing special frameworks for large load additions, including “connect-and-manage” concepts and possible pathways for customers that bring new generation or accept curtailment. ERCOT introduced a batch process for loads of 75 MW or greater so the system can assess large projects collectively rather than one by one. In other words, data-center interconnection policy is becoming part of AI industrial policy.

The strategic response from technology companies is increasingly visible in power procurement. Microsoft’s 20-year agreement with Constellation supports the restart of the 835 MW Crane Clean Energy Center. Google’s agreement with Kairos Power creates a path to up to 500 MW of advanced nuclear capacity by 2035, with the first deployment targeted for 2030. Meta signed a 20-year agreement supporting 1,121 MW at Constellation’s Clinton plant while separately pursuing new nuclear projects. These transactions should not be read simply as sustainability initiatives. They are long-duration attempts to secure firm power and reduce future energy optionality risk.

The central Solten & Co. conclusion is that the AI infrastructure stack is being reordered. Chips remain essential, but chips depreciate quickly and can be procured from multiple vendors over time. A credible high-voltage interconnection, transmission pathway and firm-power arrangement can take many years to create and may be much harder to replicate. In constrained regions, the most durable infrastructure moat may therefore move from ownership of compute equipment toward control of time-to-power.

Key Findings

  1. Power is becoming a first-order AI input. Data centers are no longer a marginal electricity category in the United States; the 2030 reference case from Berkeley Lab implies roughly one-eighth of national electricity consumption.
  2. The critical scarcity is not electricity in the abstract but deliverable electricity at a specific place and time. Grid connection, transmission capacity, transformers, substations, firm generation and queue position determine whether nominal power supply can actually become usable AI capacity.
  3. AI development and grid development operate on different clocks. Data centers can be built faster than generation and transmission can be interconnected, creating a growing premium on pre-secured energization.
  4. Virginia shows how energization rights can acquire economic value. Dominion reports 25 GW of new data centers with assigned energization dates and another 45 GW without dates.
  5. Utility contracts are becoming strategic obligations. Virginia’s new large-load framework requires long contract periods and minimum payments designed to reduce the risk that ordinary ratepayers finance infrastructure for projects that later underutilize or abandon capacity.
  6. Grid policy is becoming part of AI competitive strategy. PJM and ERCOT are redesigning large-load processes around reliability, curtailment, generation contribution and project readiness.
  7. Firm power is creating a new class of technology-energy transactions. Nuclear restarts, life extensions, advanced nuclear development, onsite generation and storage are increasingly linked to technology-company load growth.
  8. Time-to-power may become a valuation variable. Data-center land with an executed path to hundreds of megawatts should not be valued like otherwise similar land with uncertain energization.
  9. The power bottleneck can reshape geography. AI clusters may migrate toward regions with faster interconnection, surplus generation, expandable transmission, fuel access and flexible large-load rules rather than simply toward historic cloud regions.
  10. The counter-thesis is meaningful. Better hardware efficiency, lower energy per AI task, load flexibility, grid reform and slower-than-expected project realization could reduce the severity of the bottleneck. The correct thesis is not “the U.S. will run out of electricity,” but that timely, location-specific, reliable capacity is becoming scarce enough to influence AI economics.

Table of Contents

  1. From GPU Scarcity to Power Scarcity
  2. The Demand Curve Has Crossed a System Threshold
  3. The Real Asset Is an Energization Right
  4. The Time-Scale Mismatch
  5. Virginia as a Leading Indicator
  6. Grid Rules Are Becoming AI Industrial Policy
  7. Power Contracts Are Becoming Strategic Obligations
  8. Why Firm Power Is Back
  9. Behind-the-Meter Power: Escape Valve, Not Free Lunch
  10. Flexibility Becomes a Currency
  11. The Capital Structure of AI Power
  12. Time-to-Power as a Valuation Variable
  13. Winners, Losers and Second-Order Effects
  14. Solten & Co. Thesis, Counter-Thesis and Falsification
  15. What to Watch Next

Sources & Evidence

Methodological Note

About Solten & Co.

Scope & Methodology

Research question. This report examines whether electricity infrastructure is becoming a binding strategic constraint on AI development in the United States, and what that shift means for data-center economics, hyperscaler strategy, utilities, power developers, infrastructure investors and adjacent technology markets.

Scope. The analysis focuses on U.S. data-center electricity demand, generator and large-load interconnection, selected regional examples, firm-power procurement and the financial implications of time-to-power. It does not forecast individual power prices, recommend securities or assume that every announced data-center project will be built.

Evidence hierarchy. Priority is given to Lawrence Berkeley National Laboratory, the International Energy Agency, FERC, PJM, ERCOT, state utility regulators, utilities and direct corporate announcements. Company energy agreements are treated as strategic evidence, not as proof that announced capacity will be delivered on schedule.

Critical limitation. Data-center project pipelines contain duplication, speculative requests and projects that will never reach operation. Electricity-demand forecasts also depend heavily on hardware efficiency, model architecture, utilization, deployment pace and AI adoption. The analysis therefore distinguishes announced load, interconnection capacity, contracted power and realized consumption.

What Changed

The power constraint is not new, but its strategic importance changed sharply in 2025–2026. The IEA estimates that capital expenditure by five major technology companies exceeded $400 billion in 2025 and is expected to rise another 75% in 2026. Its satellite-based tracking indicates that cutting-edge “AI factory” capacity more than tripled in roughly eighteen months. This is industrial expansion at a speed the electricity system was not designed to mirror.

At the same time, the energy intensity of individual AI tasks is falling quickly. The IEA reports at least an order-of-magnitude annual decline in energy per AI task in recent years. That would normally relieve infrastructure pressure. But the mix of work is changing toward reasoning, video and agentic tasks that can consume hundreds or thousands of times more energy than simple text queries, while usage itself is growing rapidly. Efficiency is therefore fighting a rebound effect rather than simply reducing total load.

The newest development is institutional. Large-load connection is no longer being treated as routine utility service. PJM, ERCOT, Virginia regulators and utilities are creating specialized rules around data centers and other large loads because a single project can now resemble a traditional power plant in scale while arriving on a technology-company timetable.

1. From GPU Scarcity to Power Scarcity

The first phase of the generative-AI infrastructure boom was dominated by accelerator scarcity. Access to NVIDIA GPUs became a competitive advantage, cloud capacity was rationed, and startups raised capital partly to secure compute. That framing remains useful, but it is incomplete in 2026.

A GPU cluster is economically useless without power. More importantly, the marginal difficulty of adding power is increasing as cluster size rises. Large AI campuses require substations, transformers, transmission upgrades, cooling systems, backup systems and generation resources capable of supporting loads measured in hundreds of megawatts or multiple gigawatts. The infrastructure problem therefore moves upstream from the server rack into the electricity system.

The IEA’s 2026 analysis highlights the physical intensity of this transition. Between 2020 and 2025, AI-server power density increased roughly eleven-fold, and by 2027 it is expected to rise another four-fold. An advanced rack could reach peak demand comparable to 65 U.S. households. Higher density improves the economics of scarce data-center floor space, but it concentrates power and thermal requirements into a much smaller physical footprint.

The strategic implication is straightforward: the AI industry can manufacture more computational density faster than the grid can manufacture new delivery capacity.

Exhibit 1 — U.S. Data Centers Are Moving From a Large Load to a System-Level Load

Berkeley Lab’s 2026 update moves the discussion beyond anecdotes. Its reference case reaches 11.8% of total U.S. electricity consumption by 2030, with a 9.5%–15.3% sensitivity range. The report estimates that AI servers account for 84% of projected server energy use and 55% of all projected data-center electricity use by 2030.

That does not mean AI will consume a fixed share regardless of price or infrastructure constraints. It means data centers are now large enough to influence generation planning, transmission investment, rate design and regional resource adequacy.

2. The Demand Curve Has Crossed a System Threshold

Electric systems routinely absorb new industrial loads. What makes AI different is the combination of size, concentration, speed and uncertainty.

Size matters because a single campus can require hundreds of megawatts. Concentration matters because data centers cluster around fiber, existing cloud regions, skilled labor and tax regimes. Speed matters because technology companies can finance and build a campus much faster than a transmission corridor or major generating plant. Uncertainty matters because announced projects can be delayed, resized, duplicated across utility queues or cancelled.

The IEA emphasizes this distinction: globally, data centers remain a modest share of electricity use, but they create outsized local integration challenges because demand is geographically concentrated. This is why national electricity abundance does not solve a local interconnection shortage.

For AI investors, the right question is therefore not “Does the United States have enough electricity?” It is “Can this specific site receive the required power, on the required date, under terms that remain economic if utilization is lower than planned?”

3. The Real Asset Is an Energization Right

In conventional data-center analysis, investors often focus on land, building cost, fiber connectivity, cooling and server economics. The current market adds another asset class: a credible energization pathway.

An energization right is not a formal legal category. It is an analytical way to describe the bundle of permissions, infrastructure and contractual commitments that allow a site to draw meaningful power. It can include utility service agreements, queue position, completed studies, transmission upgrades, substation capacity, generation contracts, transformer procurement and regulatory approvals.

This distinction matters because two sites with identical acreage can have radically different economic value. One may have an executable path to 500 MW in 2028. Another may have theoretical access to a large regional grid but no credible connection date before 2032. The second site is not merely “later.” It may miss an entire hardware and model cycle.

In AI infrastructure, time has unusually high option value. A two-year delay can mean several generations of accelerators, lower model costs, different cooling architectures and changed demand assumptions. That makes a secured energization date economically closer to a scarce real option than to a routine utility connection.

4. The Time-Scale Mismatch

Exhibit 2 — AI Infrastructure Is Being Built on a Faster Clock Than the Grid

The mismatch is visible in development timelines. The IEA notes that a data center can be operational in roughly two to three years. Berkeley Lab’s July 2026 interconnection update shows that the median duration from generator interconnection request to signed interconnection agreement was well above three years in 2025, while the path to commercial operation exceeded five years in regions with available data.

These are not perfectly comparable processes: one describes building a load asset, the other adding generation. But that is precisely the point. Demand can materialize faster than supply can be studied, permitted, financed, connected and commissioned.

The queue itself is enormous. Berkeley Lab counted 2,061 GW of generation and storage actively seeking U.S. interconnection at the end of 2025. More than 750 GW of requests were withdrawn during the year, and historically only 13% of capacity submitted from 2000–2020 had reached operation by the end of 2025. A large queue therefore does not equal a large pipeline of near-term power.

This is why nominal resource announcements can mislead AI infrastructure investors. A region may have hundreds of gigawatts “in queue” while still lacking enough firm, deliverable capacity for a data-center campus on the required timetable.

5. Virginia as a Leading Indicator

Northern Virginia became the world’s most important data-center market because it combined fiber, cloud-network effects, business density, land development expertise and historically reliable power access. Its current constraints therefore deserve attention as a preview of what can happen elsewhere.

Exhibit 3 — In Virginia, the Scarce Asset Is Increasingly an Energization Date

Dominion Energy reports that it has assigned energization dates through 2031 to 25 GW of new data centers where capacity is currently available or expected to be connected. For another 45 GW of proposed new data-center projects, future connection dates have not yet been offered.

The striking point is not that all 70 GW will be built. They almost certainly will not be. The point is that the request pipeline is large enough that the utility must explicitly ration certainty about when projects can connect.

Virginia regulators have also changed the commercial relationship. The State Corporation Commission established a separate GS-5 rate class for large loads. New qualifying customers contracting from 2027 are subject to a minimum 14-year service obligation. Large-load customers are generally required to pay at least 85% of the transmission and distribution costs incurred to serve them each month regardless of actual usage, and some customers may need to provide collateral covering a substantial portion of minimum charges.

This is economically important. Utilities are effectively saying: if the grid makes long-lived investments for an AI campus, the customer must assume part of the stranded-asset risk.

6. Grid Rules Are Becoming AI Industrial Policy

When connection to the grid determines where AI infrastructure can be built, interconnection rules become a competitive-policy variable.

PJM, the largest U.S. regional transmission organization, initiated an accelerated process in 2025 to address large load additions and spent 2026 developing reliability-focused solutions. One direction is a “connect-and-manage” framework in which certain large loads could connect before all necessary system upgrades are complete if they accept curtailment or otherwise operate within reliability limits. PJM has also explored distinctions between loads that bring new generation and those that do not.

ERCOT moved in a different but related direction. In June 2026, Texas regulators approved “Batch Zero,” a process that groups qualified large loads of 75 MW or greater so ERCOT can assess their combined system impact, allocate available capacity and identify transmission needs. The logic resembles modern generator-queue reform: study projects as a portfolio rather than allowing a flood of individually evaluated requests to overwhelm the system.

These changes create strategic questions for AI operators. Is a flexible connection better than waiting years for fully firm service? Is building or contracting new generation worth faster connection? How much curtailment can a training cluster tolerate? Can inference workloads be shifted geographically or temporally? The answer will vary by workload.

Grid design is therefore becoming part of systems architecture.

7. Power Contracts Are Becoming Strategic Obligations

AI companies are already accustomed to large, long-term compute commitments. The energy layer is developing similar characteristics.

A multi-year power arrangement can lock in access to scarce capacity, support financing of new generation and improve certainty for a data-center build. But it also creates risk if model economics, hardware efficiency or demand growth change faster than expected.

The Virginia GS-5 structure makes the analogy explicit. Minimum payment obligations and long contract terms transform electricity from a fully variable operating cost into something closer to a quasi-fixed strategic commitment. The customer is not legally issuing debt, but economically it may be assuming a long-duration obligation tied to infrastructure that was built for its anticipated load.

This mirrors a broader pattern already visible in AI compute contracts: the industry is trading future flexibility for present capacity.

8. Why Firm Power Is Back

Renewables remain essential to data-center power procurement, but very large AI loads place a premium on firm capacity: electricity that can be delivered reliably across hours and seasons, not merely matched annually through renewable-energy certificates.

The strategic value of firm power helps explain the new technology-company interest in nuclear energy.

Microsoft / Constellation. A 20-year power purchase agreement supports the restart of the former Three Mile Island Unit 1 as the Crane Clean Energy Center, expected to add approximately 835 MW of carbon-free generation to the grid.

Google / Kairos Power. Google and Kairos created a multi-plant development agreement for up to 500 MW of advanced nuclear generation by 2035, with the first deployment targeted for 2030.

Meta / Constellation. Meta signed a 20-year agreement supporting continued operation of the 1,121 MW Clinton Clean Energy Center beginning in 2027, while separately pursuing new nuclear capacity through a broader request-for-proposals process.

These transactions are structurally different and should not be added together as if they were comparable delivered capacity. Some preserve existing plants, some restart retired assets, and some attempt to commercialize new reactor designs. What they share is the willingness of technology companies to make long-duration commitments to power infrastructure because future firm capacity has strategic value.

The energy company is becoming part of the AI supply chain.

9. Behind-the-Meter Power: Escape Valve, Not Free Lunch

Slow grid connections are pushing some developers toward onsite or behind-the-meter generation. The attraction is obvious: if the grid cannot deliver power quickly enough, build generation closer to the load.

The IEA’s 2026 work identifies onsite natural-gas generation as an emerging U.S. data-center response and notes that a meaningful share of tracked projects has already begun land clearing or construction. But onsite generation does not eliminate infrastructure constraints; it changes them.

A reliable isolated system needs redundancy. The IEA estimates that reliable onsite gas generation for critical, variable data-center load may require 30%–70% overbuilding relative to demand. Developers then face turbine availability, gas-pipeline capacity, emissions permitting, maintenance, noise, local opposition and financing requirements.

Behind-the-meter power is therefore not “free from the grid.” It is a substitution of one infrastructure stack for another.

10. Flexibility Becomes a Currency

The easiest data-center load for a power system to serve is not necessarily the smallest. It is the load that can adapt when the system is stressed.

AI infrastructure has several potential flexibility levers: delaying non-urgent training runs, shifting training across regions, modulating batch inference, using batteries for short-duration support, operating backup or onsite generation, and designing software to move work between facilities.

The IEA estimates that 20–25 GW of battery storage could be installed in data centers globally by 2030. If appropriately controlled and compensated, some of that storage can support both the facility and the wider grid.

This creates a new trade: faster grid access in exchange for operational flexibility. The emerging PJM connect-and-manage concept illustrates the direction. A data center that can curtail during limited system events may be economically easier to connect than one demanding fully firm, inflexible capacity from day one.

For AI architects, resilience and electricity-market participation may therefore become part of workload orchestration.

11. The Capital Structure of AI Power

Power scarcity changes capital requirements across the AI value chain.

First, data-center developers may need to finance substations, transmission upgrades, generation assets and long-lead electrical equipment earlier in the project cycle.

Second, utilities require greater certainty that large-load customers will actually materialize. Minimum contracts, collateral, and readiness milestones transfer more development risk back to the customer.

Third, generation developers gain a new class of anchor offtaker. A creditworthy technology company willing to sign a long-term agreement can make a nuclear restart, gas plant, renewable project, storage installation, or advanced-energy demonstration financeable.

Fourth, private infrastructure capital moves closer to AI economics. Investors financing generation and grid assets increasingly need a view on model demand, data-center utilization, and hyperscaler capital spending because those variables determine whether the load supporting the infrastructure remains durable.

The separation between “technology investing” and “energy infrastructure investing” is becoming less useful.

12. Time-to-Power as a Valuation Variable

The most important investment implication may be a change in how AI infrastructure assets are valued.

A traditional data-center valuation can emphasize leased megawatts, utilization, rent, replacement cost, tenant quality and cap rates. In the AI era, investors may need to add a more explicit measure: time-to-power certainty.

Consider two otherwise similar development sites:

  • Site A has land, fiber, permits, and an executed utility pathway to 300 MW by 2028.
  • Site B has cheaper land and excellent fiber but no credible energization date before 2031.

The difference is not simply three years of lost rent. Site A can host hardware generations, model launches, and customer demand that Site B may never capture. It can also give the tenant negotiating leverage in compute procurement because the limiting input has already been secured.

This suggests a new hierarchy of AI infrastructure assets:

  1. Powered and operating capacity.
  2. Contracted capacity with high-confidence energization dates.
  3. Advanced-stage capacity with identified upgrades and generation.
  4. Speculative powered-land claims without firm delivery dates.
  5. Land with only conceptual access to future grid capacity.

Markets that fail to distinguish these categories risk overvaluing “gigawatts” that are not economically deliverable.

13. Winners, Losers and Second-Order Effects

Potential winners

Existing firm generation. Nuclear plants, efficient gas generation, hydro and other reliable assets gain strategic value when power becomes scarce.

Utilities and transmission developers that can add capacity quickly. Regions able to plan and build credible infrastructure can attract high-value AI investment.

Electrical equipment suppliers. Transformers, switchgear, power electronics, turbines, cooling, and storage become critical links in the AI supply chain.

Data-center developers with real interconnection rights. A credible power position can differentiate otherwise commoditized real estate.

Flexible AI operators. Companies able to shift workloads, use storage or tolerate curtailment can monetize flexibility through earlier or cheaper connections.

Potential losers

Speculative data-center land. Sites marketed around theoretical future power may be repriced as buyers demand harder evidence of energization.

Inflexible large loads. Customers requiring fully firm service at all times may face higher connection costs and longer delays.

Ratepayers if cost allocation is poorly designed. If utilities build expensive infrastructure for projects that later disappear, stranded costs can shift to other customers. This risk is precisely why new large-load tariffs are emerging.

AI projects with mismatched commitments. A company can over-contract both compute and power if demand or monetization fails to scale.

Second-order effects

Power constraints can alter AI geography. Regions with available generation, fuel, transmission and faster permitting may gain share from established hubs. They can also change semiconductor economics: efficiency per watt becomes more valuable when the bottleneck is electricity rather than chip supply alone.

Third-order effects reach industrial policy. Governments increasingly face trade-offs among data centers, manufacturing, household affordability, electrification and grid reliability. Decisions about who pays for new generation and transmission can influence where the next AI clusters are built.

14. Solten & Co. Thesis, Counter-Thesis and Falsification

Solten & Co. Thesis

The durable bottleneck in frontier AI infrastructure is moving upstream from accelerator procurement toward the ability to secure and energize large quantities of power on a predictable timetable. As this happens, queue position, utility contracts, transmission access, firm generation, and load flexibility acquire strategic and financial value. In constrained regions, time-to-power becomes a competitive moat.

Counter-Thesis

The market may be extrapolating peak infrastructure demand too aggressively. Energy efficiency per AI task is improving extremely quickly. Specialized chips, better cooling, higher utilization, workload routing, and lower-cost models can reduce power per unit of useful output. Many announced data-center projects will never be built. Grid reform can accelerate interconnection, and flexible loads can reduce the requirement for new firm capacity. If AI monetization grows more slowly than infrastructure commitments, today’s perceived power scarcity could turn into localized overcapacity.

Falsification Criteria

The thesis would weaken materially if several of the following occur:

  • Berkeley Lab’s U.S. data-center electricity-demand trajectory is repeatedly revised sharply downward because AI-server deployments or utilization disappoint.
  • Median generator and large-load interconnection timelines fall enough that power no longer constrains site delivery.
  • Major data-center markets develop large surplus generation and transmission capacity without materially higher customer costs.
  • AI efficiency gains consistently outpace growth in model usage and capability, reducing aggregate electricity demand.
  • Large-load queues experience very high cancellation rates without corresponding executed projects, revealing much of the apparent scarcity as speculative duplication.
  • Corporate firm-power agreements fail to expand beyond a small number of flagship transactions.
  • Utilities stop requiring special tariffs, minimum obligations or collateral because stranded-asset risk proves immaterial.

15. What to Watch Next

Data-center electricity share. Track the 2026 Berkeley Lab reference case against actual server shipments, utilization and regional load.

Energization queues. The ratio of projects with assigned connection dates to projects merely requesting capacity may become more informative than headline gigawatts.

Large-load tariff design. Watch minimum contract terms, collateral, cost allocation, and curtailment rules across Virginia, Texas, PJM states, and other fast-growing markets.

Bring-your-own-generation frameworks. A wider use of customer-supported generation would strengthen the thesis that power procurement is moving inside AI infrastructure strategy.

Nuclear execution. Restarts, uprates, and advanced-reactor milestones matter more than announcement volume. Delivery schedule is the key evidence.

Onsite gas and storage. Growth would indicate that developers are willing to pay a premium to bypass grid timing constraints.

Transformer and turbine lead times. If these equipment bottlenecks remain severe, nominal generation investment may still fail to translate into rapid energization.

Geographic migration. Watch whether new AI campuses shift toward regions with faster time-to-power even when those regions are less established as cloud hubs.

Power intensity per useful AI outcome. The long-term balance depends on whether efficiency gains outrun the growth in reasoning, agentic, and multimodal workloads.

Sources & Evidence

Primary/authoritative research and system sources

Lawrence Berkeley National Laboratory — United States Data Center Energy Usage Report: 2025 Update, June 2026

https://datacenters.lbl.gov/publications/united-states-data-center-energy-2025

Lawrence Berkeley National Laboratory — Queued Up / U.S. generator interconnection update, July 1, 2026

https://emp.lbl.gov/news/backlog-power-plants-seeking-transmission-grid-connection-eased-somewhat-2025-amidst

International Energy Agency — Key Questions on Energy and AI, April 16, 2026

https://www.iea.org/reports/key-questions-on-energy-and-ai

International Energy Agency — Energy and AI, April 2025

https://www.iea.org/reports/energy-and-ai

Federal Energy Regulatory Commission — Order No. 2023, Generator Interconnection Reforms

https://www.ferc.gov/explainer-interconnection-final-rule

PJM — Critical Issue Fast Path: Large Load Additions

https://www.pjm.com/committees-and-groups/cifp-lla

PJM — Connect and Manage Senior Task Force

https://www.pjm.com/committees-and-groups/task-forces/camstf

ERCOT — Large Load Integration / Batch Zero

https://www.ercot.com/services/rq/large-load-integration

ERCOT — PUCT Approves Batch Zero Process, June 18, 2026

https://www.ercot.com/news/release/06182026-puct-approves-ercots

Virginia State Corporation Commission — Data Center Initiatives / GS-5 large-load framework

https://www.scc.virginia.gov/about-the-scc/scc-facts/

Dominion Energy Virginia — Meeting the Demands for Large-Load Customers, 2026

https://sustainability.dominionenergy.com/GS-5%20Large%20Load%20Rate%20Class%20Report.pdf

Selected corporate firm-power signals

Constellation — Microsoft / Crane Clean Energy Center, September 20, 2024

https://investors.constellationenergy.com/news-releases/news-release-details/constellation-launch-crane-clean-energy-center-restoring-jobs

Google — Kairos Power advanced nuclear agreement, October 14, 2024

https://blog.google/company-news/outreach-and-initiatives/sustainability/google-kairos-power-nuclear-energy-agreement/

Kairos Power — Google partnership / 500 MW deployment pathway

https://www.kairospower.com/google

Meta — Constellation nuclear agreement, June 3, 2025

https://about.fb.com/news/2025/06/meta-constellation-partner-clean-energy-project/

Methodological Note

Electricity-demand forecasts, data-center pipelines and interconnection queues should not be treated as committed realized capacity. This report intentionally separates electricity consumption, requested interconnection capacity, announced projects, assigned energization dates, executed power contracts and operating generation. Quantities from different categories are not added together.

The term energization right is a Solten & Co. analytical concept, not a regulatory or accounting classification. It describes the economic value of having a credible, sufficiently advanced path to deliver a defined quantity of power to a site by a useful date.

The AI Boom Is Becoming a Financing System

What NVIDIA’s new disclosures reveal about demand, credit and the next infrastructure bottleneck.

PUBLIC RESEARCH BRIEF  |  31 AUGUST 2026  |  RA-0010 

KEY THESIS  AI infrastructure is no longer financed through a simple chain from customer demand to equipment purchase. Suppliers, clouds, model makers, and capital providers increasingly underwrite one another. That can extend the buildout, but it makes independent end demand, utilization, and credit transfer the decisive investor tests.

Research snapshot

Field Detail
Research question What do NVIDIA’s latest results and ecosystem commitments reveal about the quality and financing of AI-infrastructure demand?
Evidence cut-off 31 August 2026
Event window 24–31 August 2026
Audience Family offices, independent investors, venture/growth funds, lean investment teams and strategy decision-makers
Scope Market structure and underwriting; not a rating or valuation opinion

Executive summary

The most consequential AI-market event of the week was not NVIDIA’s earnings beat in isolation. It was the combination of three disclosures made on 26 August: quarterly revenue reached $96.2 billion; AWS said it plans to deploy two million additional NVIDIA GPUs in 2027–2028; and NVIDIA described a much broader role in financing the ecosystem that buys and deploys its systems.[1]–[3] Taken together, the disclosures show that the AI infrastructure cycle is changing form.

NVIDIA is still a semiconductor and systems supplier. It is also becoming an arranger and backstop of capacity. Its filing lists $279 billion of supply commitments, $99 billion of equity investments, $25 billion of further equity commitments, $36 billion of typically six-year cloud-service commitments with selected AI-cloud partners, credit guarantees for data-center obligations and memoranda with capital providers intended to mobilize more than $500 billion over time.[2] Those figures represent different instruments and cannot be added into a single exposure number. Their significance is structural: the vendor is helping secure inputs, fund customers, support leases and connect projects with outside capital.

This does not prove weak demand or improper revenue recognition. NVIDIA’s operating evidence is exceptionally strong: Data Center revenue was $89.0 billion, up 117% year on year, and gross margin was 75.0%.[1] AWS also reported 37% growth in its cloud business and $16.6 billion of AWS operating income in the June quarter.[4] The more important conclusion is that chip demand, customer credit, data-center construction and capital formation can no longer be underwritten separately.

The investment question has therefore changed. Announced GPUs and booked chip revenue are insufficient measures of end demand. Investors need to know who ultimately pays for the compute, whether capacity is energized and utilized, how much vendor support sits behind the buyer, and which balance sheet absorbs a delay. The next phase of the cycle will be decided by third-party utilization and asset productivity, not by purchase orders alone.

Exhibit 1. Revenue and commitments now sit on the same analytical page

Sources: NVIDIA Q2 FY2027 results and Form 10-Q.[1], [2]

What changed

The scale of the AWS announcement matters. In March, AWS had said it would add more than one million NVIDIA GPUs beginning in 2026. It now plans a further two million Blackwell Ultra, Rubin and Rubin Ultra GPUs in 2027–2028, alongside 100,000 GPUs for U.S. federal and national-security workloads.[3] The announcement spans chips, CPUs, networking, open models, data processing and robotics. It is less a hardware order than an attempt to standardize a full AI-production stack.

The filing matters more than the headline. NVIDIA said selected AI-cloud partners buy its infrastructure while NVIDIA commits to purchase cloud capacity that those partners may instead sell to third parties. The commitments totaled $36 billion at quarter-end and are typically six years long.[2] NVIDIA may share in third-party revenue. Economically, the arrangement can accelerate deployment, but it also means the supplier can become a buyer of the capacity created with its own products.

NVIDIA also disclosed $3.529 billion of notional land, power and shell guarantees for selected AI clouds, partially mitigated by $712 million in escrow. Separately, it described guarantees connected with approximately 4.25 gigawatts at SB Energy’s Ohio campus for OpenAI leases, with its aggregate obligation capped at $105 billion subject to conditions.[2] These are contingent exposures, not current cash outlays, but they show how far the bottleneck has moved beyond the GPU.

Why the system is emerging

The supply chain is being built years ahead of realized application revenue. Semiconductor capacity, memory, racks, land, substations, cooling and generation have long lead times. Model makers and AI clouds often have strong growth but lack the investment-grade balance sheets needed to sign twenty-year leases or finance multi-gigawatt campuses. NVIDIA states this problem directly in its filing.[2]

A vertically coordinated financing system is a rational response. The chip vendor secures manufacturing supply. A cloud operator commits to equipment and capacity. A model maker signs a long-term compute or lease agreement. Infrastructure investors lend against those contracts. Vendor guarantees or capacity purchases make the package financeable. Each link can be commercially sensible. The system becomes fragile only when several links rely on the same unproven end demand.

Amazon illustrates the scale. Its AWS property and equipment rose from $190.1 billion at year-end 2025 to $263.8 billion at 30 June 2026, while cash capital expenditure reached $53.1 billion in the second quarter and $96.3 billion in the first half.[5] AWS growth supports that spending, but the capital burden is visible: Amazon’s trailing-twelve-month free cash flow moved to an outflow of $7.6 billion, primarily because AI-related property purchases increased.[4]

Exhibit 2. The AI infrastructure capital chain

Source: Solten & Co. framework based on disclosed commercial and financing structures.[2], [3], [5]

The four tests investors should use

First, separate deployment demand from independent end demand. A GPU sale to an AI cloud is deployment demand. Revenue paid by an unrelated enterprise, developer or government for sustained compute usage is closer to end demand. Both matter, but only the second demonstrates that the installed asset can service its capital cost without continuing support from the supplier or a related ecosystem participant.

Second, map credit transfer. Extended payment terms, guarantees, leases, vendor investments and capacity-purchase agreements move risk without eliminating it. NVIDIA provides some investment-grade customers with payment terms of 90 days to one year for large builds; five direct customers represented 22%, 14%, 13%, 11% and 10% of accounts receivable at quarter-end.[2] The relevant question is not whether a structure is circular in a rhetorical sense. It is which party bears the loss if utilization or financing arrives late.

Third, measure asset productivity. The useful denominator is energized, revenue-producing capacity. Investors should track third-party revenue and gross profit per deployed GPU and per energized megawatt, utilization by cohort, realized price per GPU-hour, renewal rates, contract duration and counterparty quality. Announced GPU counts and contracted megawatts are pipeline measures.

Fourth, underwrite physical delivery. NVIDIA identifies land, power, shell and capital as critical constraints.[2] The IEA expects global data-center electricity consumption to roughly double from 485 TWh in 2025 to 950 TWh in 2030, while bottlenecks in grids, transformers and other energy equipment constrain more aggressive near-term growth.[8] A data center without timely power is not inventory in the ordinary sense; it is a long-duration development exposure.

Exhibit 3. A practical underwriting dashboard

Source: Solten & Co. framework.

Counter-thesis

The strongest counterargument is that these arrangements are evidence of market strength, not hidden weakness. NVIDIA has the cash generation, supply visibility and ecosystem knowledge to remove bottlenecks that smaller customers cannot solve. AWS has a large, profitable cloud business and reports customer commitments for substantial portions of its investment. Guarantees and capacity purchases may function like supplier finance in other capital-intensive industries: they accelerate a sound market rather than manufacture it.

That view is plausible and consistent with current revenue growth. It would be strengthened by high third-party utilization, stable realized compute prices, growing enterprise production workloads, declining vendor support as customers mature and cash returns on AI infrastructure above the cost of capital. The bearish interpretation would gain weight if capacity commitments outgrow third-party revenue, supported customers repeatedly refinance, vendor purchases become a material share of cloud demand, or energized assets operate below underwriting assumptions.

The evidence does not justify calling the cycle circular in a pejorative sense. It does justify treating related financing and commercial support as part of the demand-quality analysis.

What to watch

The most informative signals will not come from announced GPU totals. Watch third-party utilization and realized pricing at AI clouds; the share of NVIDIA revenue linked to customers receiving equity, guarantees, extended terms or capacity support; changes in accounts-receivable concentration and days sales outstanding; conversion of preliminary financing memoranda into funded vehicles; and the performance of campuses backed by long leases and contingent guarantees.

Physical triggers matter as much as financial ones. Track energized megawatts versus contracted megawatts, interconnection and construction delays, transformer and cooling lead times, local restrictions on data-center water and power use, and the cost of firm electricity. The White House’s 26 August power-system order and New Jersey’s 27 August data-center measures show that power equipment, security, transparency and community costs are moving into the policy core.[6], [7], [15]

Finally, track the relationship between application revenue and infrastructure spending. If enterprise and consumer AI revenue scales fast enough to support the asset base, vendor finance will look like an effective bridge. If it does not, the system will reveal stress first in utilization, refinancing, contract renegotiation, and asset impairment—not necessarily in chip shipments.

Conclusion

The week’s largest number was two million GPUs. The more consequential number may be $36 billion: NVIDIA’s disclosed commitments to buy capacity from selected AI-cloud partners. It marks a transition from selling scarce hardware into a market where the supplier also helps make deployment financeable. That is not inherently a warning sign. It is a change in the unit of analysis. Investors must now underwrite the whole chain—from fabrication and power to customer credit and productive utilization. The AI buildout can remain extraordinary while becoming harder to read. The winners will be the assets and companies that convert supported deployment into independently paid, persistently used capacity before support costs catch up.

Sources and evidence

Evidence cut-off: 31 August 2026. Company announcements establish announced plans; SEC filings control where the two differ. Estimates, scenarios and interpretations are identified as such.

  1. NVIDIA, Q2 FY2027 results, 26 August 2026. Source
  2. NVIDIA, Form 10-Q for quarter ended 26 July 2026. Source
  3. AWS and NVIDIA, two million additional GPUs, 26 August 2026. Source
  4. Amazon, Q2 2026 results. Source
  5. Amazon, Form 10-Q for quarter ended 30 June 2026. Source
  6. White House, Executive Order on the U.S. bulk-power system, 26 August 2026. Source
  7. White House, fact sheet on bulk-power system security, 26 August 2026. Source
  8. IEA, Key Questions on Energy and AI, 2026. Source
  9. IEA, Energy and AI, 2025. Source
  10. U.S. DOE, data-center electricity demand report, 20 December 2024. Source
  11. U.S. DOE, Powering America’s AI Future data-center resource hub. Source
  12. SLB, agreement to acquire Kelvion, 31 August 2026. Source
  13. AP, NVIDIA Q2 coverage, 26 August 2026. Source
  14. Axios, NVIDIA earnings and circular-financing debate, 26 August 2026. Source
  15. New Jersey Governor, data-center transparency measures, 27 August 2026. Source
  16. CoreWeave, Form 10-Q for quarter ended 30 June 2026. Source

Research disclosure

This report is independent research for informational purposes. It is not investment, legal, tax, or accounting advice and does not recommend a security or transaction. The analysis relies on public information available by the evidence cut-off. Announced capacity is not the same as deployed, energized, or utilized capacity. Scenarios are analytical tools, not forecasts.

OpenAI, Anthropic & the New Compute Power Structure

Why the frontier-model race is becoming a contest over capital, cloud distribution, custom silicon, and infrastructure optionality.

Solten & Co. Research Report
Updated: August 20, 2026
Research universe: AI Infrastructure / Software AI / Capital & Deals

Research Passport

  • Publication type: Flagship Research Report
  • Publication version: 1.0
  • Published/updated: August 20, 2026
  • Evidence cut-off: August 20, 2026
  • Research universe: AI Infrastructure / Software AI / Capital & Deals
  • Estimated reading time: ~25 minutes
  • Original research exhibits: 3
  • Primary and high-quality sources: 17+

Intended audience: investors, family offices, venture and growth funds, AI infrastructure operators, strategy leaders and other decision-makers evaluating frontier AI economics. 

Key Findings

  1. Frontier AI is becoming an industrial system, not merely a software-model competition. Capital, power, data centers, silicon, cloud infrastructure, frontier models and distribution are now tightly coupled.


  1. The old “OpenAI is locked into Azure” narrative is no longer an adequate description of the market. Microsoft remains central, but OpenAI has deliberately built infrastructure and capital optionality across AWS, NVIDIA, Oracle, CoreWeave and other partners while renegotiating exclusivity.


  1. Anthropic’s multi-provider strategy has become materially larger than the roughly $50 billion compute picture often repeated in older analysis. By 2026, its disclosed relationships span AWS Trainium, Google/Broadcom TPUs, Microsoft Azure/NVIDIA capacity, SpaceX GPU infrastructure and additional infrastructure programs.


  1. Strategic AI transactions increasingly combine equity, compute purchase commitments, cloud distribution, IP/model access and commercial participation. Headline “investment” values can therefore be misleading unless the economic layers are separated.


  1. Long-term compute commitments deserve to be analyzed as quasi-fixed strategic obligations. The central risks are not only model performance but also demand, utilization, silicon obsolescence, falling compute prices, capital dependence, and counterparty concentration.

Table of Contents

  1. The Source Thesis — What the Sources Get Right
  2. OpenAI–Microsoft: The Original Strategic Flywheel
  3. Revenue Sharing: Real, Material — but Frequently Misdescribed
  4. The Biggest Update: OpenAI Is No Longer Simply “Locked into Azure”
  5. OpenAI’s AWS Pivot: From Azure Dependency to Infrastructure Portfolio
  6. Anthropic: Multi-Cloud as Strategy, Not Temporary Compromise
  7. Anthropic’s 2026 Scale-Up Makes the Original Numbers Obsolete
  8. Consumer vs. Enterprise: Useful Distinction, Weak Precision
  9. The Economics: The Real Constraint Is Not “Model Quality” but Cost of Intelligence
  10. The New Strategic Map: Reciprocal Dependence, Not Simple Cloud Control
  11. Capital Is Becoming Part of the Compute Contract
  12. Compute Commitments Are Emerging as a Form of Strategic Debt
  13. What the 2026 Market Says About Anthropic vs. OpenAI
  14. What to Watch Next — Investor Monitoring Framework
  15. Solten & Co. View

Scope & Methodology

Research question. This report examines how the strategic and economic relationships surrounding OpenAI and Anthropic have changed the competitive structure of frontier AI, with particular attention to capital, cloud distribution, compute commitments, silicon strategy, contractual optionality, and infrastructure dependence.

Scope. The report focuses on publicly disclosed or credibly reported relationships involving OpenAI, Anthropic, Microsoft, Amazon/AWS, Google, NVIDIA and selected infrastructure providers. It is not intended as a comprehensive valuation of either OpenAI or Anthropic, nor as an investment recommendation.

Evidence hierarchy. Priority is given to company disclosures, partner announcements, and other primary evidence. High-quality financial reporting is used where material commercial terms are not publicly disclosed. The report avoids treating media-reported terms as audited company facts.

Evidence classes used in this report:

DISCLOSED FACT — directly supported by a primary or authoritative source.

REPORTED TERM — reported by a credible secondary source but not independently disclosed by the relevant counterparty.

ESTIMATE — a quantitative or qualitative assessment based on incomplete public information.

SOLTEN & CO. INTERPRETATION — our synthesis, inference, or analytical conclusion.

Limitations. Large AI infrastructure agreements are unusually difficult to compare. A dollar investment, a multi-year compute purchase commitment, an “up to” gigawatt capacity announcement, and realized installed/utilized capacity are different economic objects. This report therefore avoids combining unlike commitments into a single headline total unless the units and assumptions are explicitly comparable.

What Changed

The sources captured an important structural shift toward infrastructure control, but several of its strongest claims have already aged materially.

OpenAI is no longer well described as a single-cloud, Azure-locked company. Its Microsoft relationship remains strategically important, yet exclusivity has been relaxed and major AWS, NVIDIA, and other infrastructure relationships now create meaningful supplier optionality.

Anthropic’s compute footprint has expanded far beyond the earlier multi-cloud figures frequently cited in 2025-era analysis. The company’s 2026 agreements make infrastructure diversification itself a core strategic capability.

The competitive framing has also changed. The relevant question is no longer simply whether hyperscalers “control” AI labs. The evidence points to reciprocal dependence: model labs need capital and compute, while hyperscalers and silicon vendors need frontier labs as anchor tenants, distribution engines, and validation customers for custom infrastructure.

Finally, the economic object called an “AI investment” is increasingly composite. Equity capital, compute commitments, distribution rights, model/IP access, and commercial revenue participation may sit inside the same strategic relationship. That makes transaction decomposition essential for serious investment analysis.

Executive Summary

The useful insight in the sources is that the frontier-model race can no longer be understood primarily as a benchmark contest. Compute, cloud distribution, capital structure, custom silicon, enterprise access, and contractual flexibility have become strategic variables in their own right.

But the market has moved materially since many of the arrangements described in the sources were formed. The most important update is that OpenAI is no longer accurately described as being structurally locked into Microsoft Azure in the old sense. Microsoft remains a major shareholder and a central strategic partner, but the relationship was progressively loosened in 2025 and 2026. OpenAI now has major compute and distribution relationships with AWS and NVIDIA, can serve products through other cloud providers under the amended Microsoft agreement, and has committed to large-scale multi-provider infrastructure. Microsoft’s OpenAI IP license is now non-exclusive, while OpenAI’s revenue share to Microsoft continues through 2030 subject to a cap.

Anthropic, meanwhile, has gone even further in constructing a deliberately diversified infrastructure strategy. AWS remains its primary cloud and training partner, but Anthropic also uses Google TPUs and NVIDIA GPUs, has Claude available across AWS Bedrock, Google Vertex AI and Microsoft Azure Foundry, and has accumulated multi-gigawatt capacity agreements across providers. In 2026, it also added SpaceX GPU capacity and expanded AWS and Google commitments dramatically.

This changes the central analytical conclusion. The emerging structure is not simply “hyperscalers own the AI labs.” It is better understood as a dense network of reciprocal dependencies: labs need capital, power, and compute; hyperscalers need frontier models to drive cloud demand, custom-silicon adoption, and enterprise AI distribution; chip vendors need anchor customers; investors need exposure to the model layer; and model companies increasingly seek infrastructure optionality to avoid strategic dependence on any single supplier.

The long-term advantage may therefore accrue not to one layer alone, but to actors that control scarce infrastructure while preserving bargaining power across the stack.

1. The Source Thesis — What the Source Gets Right

The source argues that the AI industry has entered a “middle game” in which model quality remains important but infrastructure control, compute access, and cloud distribution increasingly determine who can operate at frontier scale.

That framing is directionally correct.

Training and serving frontier models has become a capital-intensive industrial activity. The relevant inputs are no longer only algorithms and training data. They include data-center capacity, power, accelerators, networking, memory, inference infrastructure, custom silicon, cloud procurement and long-term financing. The frontier-model companies are therefore becoming unusually intertwined with hyperscalers, semiconductor vendors and infrastructure financiers.

OpenAI itself described the 2026 scaling problem in three words: “compute, distribution, and capital.” In February 2026, when announcing $110 billion of new investment, the company said leadership in the next phase would be defined by who could scale infrastructure fast enough to meet demand and convert that capacity into products used at global scale.

This is an important shift in how the sector should be analyzed. A useful company model can no longer stop at product quality, model benchmarks, or subscription growth. It must also ask:

  • Who finances the company’s infrastructure?
  • Which cloud providers distribute the models?
  • What silicon does the company depend on?
  • How much power and capacity has it contracted?
  • Which agreements are exclusive?
  • Which agreements create minimum-purchase or long-term compute obligations?
  • Who receives revenue shares?
  • Where can the company switch providers, and at what economic or technical cost?
  • What does the infrastructure partner receive beyond direct cloud revenue — equity appreciation, custom-silicon validation, enterprise distribution or strategic leverage?

That is the stronger framework behind the source.

2. OpenAI–Microsoft: The Original Strategic Flywheel

Microsoft’s relationship with OpenAI began as a strategic shortcut into frontier AI. Microsoft invested $1 billion in OpenAI in 2019 and subsequently expanded the relationship through additional capital, cloud capacity, IP rights, and distribution arrangements.

The logic was powerful on both sides.

OpenAI received access to a hyperscaler capable of financing and deploying enormous compute clusters. Microsoft received privileged access to frontier-model IP, a differentiated Azure AI offering, and the ability to incorporate OpenAI technology across products such as Copilot and Microsoft 365.

For several years, this created a reinforcing system:

Microsoft capital → OpenAI compute demand → Azure revenue → OpenAI model improvement → Microsoft product differentiation → enterprise Azure demand.

The structure also made Microsoft simultaneously investor, infrastructure provider, distributor, and commercial beneficiary.

In October 2025, OpenAI completed a major recapitalization. Microsoft’s investment in OpenAI Group PBC was valued at approximately $135 billion, representing roughly 27% of the company on an as-converted diluted basis. OpenAI’s nonprofit parent — the OpenAI Foundation — held 26%, while employees and other investors held the remaining 47%.

This part of the source is substantially correct: Microsoft ended up with an economic stake in OpenAI worth about $135 billion, although the precise percentage is better stated as roughly 27%, not a loose 26–30% range.

3. Revenue Sharing: Real, Material — but Frequently Misdescribed

The Microsoft–OpenAI relationship has included revenue-sharing arrangements flowing in both directions.

Historically, reporting indicated that OpenAI agreed to share approximately 20% of revenue with Microsoft through 2030. In 2025, Reuters reported that OpenAI planned to reduce Microsoft’s share over time, but the companies subsequently confirmed that the revenue-sharing arrangement remained in place.

The structure changed again in April 2026.

Microsoft stated that it would no longer pay a revenue share to OpenAI. Revenue-share payments from OpenAI to Microsoft would continue through 2030 at the same percentage, but subject to an overall cap. Reuters subsequently reported, citing The Information, that the total future revenue-sharing obligation had been capped at approximately $38 billion.

This is materially different from the older picture in which reciprocal revenue sharing was treated as a relatively stable permanent mechanism.

The investment implication is important. Microsoft still has several distinct ways to benefit economically from OpenAI:

  1. Equity appreciation through its roughly 27% ownership position.
  2. Revenue-share payments from OpenAI through 2030, subject to the agreed cap.
  3. Azure consumption and broader infrastructure revenue.
  4. Product differentiation and enterprise distribution through Microsoft’s own AI products.
  5. Strategic spillovers into Microsoft’s cloud and developer ecosystem.

The source’s claim that Microsoft captured $865 million through revenue sharing in the first nine months of 2025 should be treated as an externally reported figure rather than a primary-source fact. We did not find a first-party Microsoft or OpenAI disclosure confirming that exact number. It may be useful context, but it should not be presented as audited public financial disclosure.

4. The Biggest Update: OpenAI Is No Longer Simply “Locked into Azure”

This is where the source narrative is now most outdated.

In early 2025, Microsoft still described the OpenAI API as exclusive to Azure and retained a right of first refusal on new compute capacity. The October 2025 agreement preserved Azure API exclusivity and Microsoft’s exclusive IP rights until AGI, while also allowing OpenAI greater freedom to build additional compute elsewhere.

By February 2026, OpenAI and Microsoft jointly clarified that Azure remained the exclusive cloud provider for stateless OpenAI APIs, even while OpenAI pursued additional compute relationships.

Then, in April 2026, the relationship changed more fundamentally.

Microsoft announced an amended agreement under which:

  • Microsoft remains OpenAI’s primary cloud partner.
  • OpenAI products generally ship first on Azure, unless Microsoft cannot or chooses not to support the required capabilities.
  • OpenAI can serve its products to customers through any cloud provider.
  • Microsoft’s license to OpenAI models and products through 2032 became non-exclusive.
  • Microsoft stopped paying revenue share to OpenAI.
  • OpenAI’s revenue-share payments to Microsoft continue through 2030, subject to a cap.

This is a major strategic shift.

The original Microsoft–OpenAI partnership was based on deep bilateral dependence. The revised structure increasingly resembles a major strategic partnership inside a broader multi-cloud and multi-capital network.

OpenAI’s subsequent AWS relationship makes this concrete.

5. OpenAI’s AWS Pivot: From Azure Dependency to Infrastructure Portfolio

In November 2025, OpenAI and AWS announced a $38 billion multi-year agreement under which OpenAI would use AWS infrastructure containing hundreds of thousands of NVIDIA GPUs.

In February 2026, that relationship expanded dramatically.

Amazon committed to invest $50 billion in OpenAI. OpenAI and AWS expanded their infrastructure agreement by another $100 billion over eight years. OpenAI committed to consume approximately 2 gigawatts of Trainium capacity, spanning Trainium3 and Trainium4, beginning to ramp in 2027.

AWS also became the exclusive third-party cloud distribution provider for OpenAI Frontier, while OpenAI and Amazon agreed to co-develop a stateful runtime environment in Amazon Bedrock and customized models for Amazon applications.

By June 2026, OpenAI frontier models and Codex were generally available on AWS.

OpenAI also announced 3 GW of dedicated NVIDIA inference capacity and 2 GW of training capacity on Vera Rubin systems, in addition to infrastructure already running across Microsoft, Oracle Cloud Infrastructure and CoreWeave.

The strategic implication is clear: OpenAI is deliberately creating infrastructure optionality.

This does not make Microsoft unimportant. Microsoft remains the primary cloud partner, major shareholder, and revenue-share recipient. But OpenAI now has multiple meaningful infrastructure and capital relationships, reducing the old single-provider concentration risk and increasing its bargaining flexibility.

6. Anthropic: Multi-Cloud as Strategy, Not Temporary Compromise

Anthropic’s infrastructure model has historically been more diversified than OpenAI’s.

AWS became Anthropic’s primary cloud provider for mission-critical workloads in 2023. In November 2024, Amazon added another $4 billion investment, bringing its total at that time to $8 billion, while AWS became Anthropic’s primary cloud and training partner.

Anthropic simultaneously deepened its Google relationship. In October 2025, it announced plans to use up to one million Google TPUs, with more than one gigawatt of capacity expected online in 2026. Anthropic explicitly described its compute strategy as diversified across Google TPUs, AWS Trainium, and NVIDIA GPUs.

In November 2025, Anthropic expanded into Microsoft Azure as well. Microsoft committed to invest up to $5 billion in Anthropic and NVIDIA up to $10 billion, while Anthropic committed to purchase $30 billion of Azure compute capacity. Claude became available in Microsoft Foundry, giving Anthropic distribution across AWS Bedrock, Google Vertex AI and Microsoft Azure.

This three-cloud distribution position was strategically unusual and important.

7. Anthropic’s 2026 Scale-Up Makes the Original Numbers Obsolete

The source cites Anthropic’s compute commitments at roughly $50 billion. That figure is no longer a useful description of current exposure.

In April 2026, Anthropic announced a new agreement with Google and Broadcom for multiple gigawatts of next-generation TPU capacity, expected to begin coming online in 2027. Anthropic said this was its most significant compute commitment to date.

Later that month, Anthropic expanded its AWS relationship to secure up to 5 GW of new capacity and committed more than $100 billion over ten years to AWS technologies. It said it was already using more than one million Trainium2 chips and that Amazon remained its primary training and cloud provider.

Amazon simultaneously invested another $5 billion, with the possibility of up to $20 billion more in future investment.

Anthropic also added more than 300 MW of NVIDIA GPU capacity through SpaceX’s Colossus infrastructure.

By mid-2026, Anthropic’s infrastructure strategy included:

  • AWS Trainium — primary cloud/training relationship, up to 5 GW of new capacity.
  • Google/Broadcom TPUs — multi-gigawatt next-generation capacity.
  • Microsoft Azure/NVIDIA — $30 billion Azure capacity relationship.
  • SpaceX — more than 300 MW of NVIDIA GPU capacity.
  • Fluidstack — part of a broader $50 billion U.S. infrastructure program.

The strategic pattern is not merely “multi-cloud.” It is active procurement diversification across cloud vendors, silicon architectures, and physical infrastructure providers.

8. Consumer vs. Enterprise: Useful Distinction, Weak Precision

The source contrasts OpenAI as consumer-driven and Anthropic as enterprise-driven. This distinction is broadly useful, but the exact percentages cited in the source should be treated cautiously.

For OpenAI, Reuters reported in late 2025 that roughly 30% of revenue came from enterprise customers, implying that the majority still came from consumer-oriented products, particularly ChatGPT subscriptions. This supports the directional claim that OpenAI was more consumer-weighted than Anthropic.

For Anthropic, multiple sources confirm unusually strong enterprise adoption. In 2025, Reuters described Anthropic’s revenue acceleration as being driven by business demand, particularly coding. Anthropic reported more than 300,000 business customers in October 2025 and more than 500 customers spending over $1 million annualized by early 2026; that figure exceeded 1,000 by April 2026.

However, the claim that “85% of Anthropic revenue comes from B2B API calls” is not supported by the first-party sources reviewed here. Anthropic is clearly enterprise-heavy, but its revenue mix now includes subscriptions, Claude Code, direct enterprise contracts, API activity and hyperscaler distribution. A single percentage may be both unverifiable and quickly obsolete.

The deeper point is more important than the percentages:

OpenAI built a massive direct consumer distribution engine first, then pushed aggressively into enterprise.

Anthropic built stronger early positioning in enterprise and developer workflows, especially coding, while using broad hyperscaler distribution to reach customers inside existing cloud environments.

By 2026, both companies are converging toward enterprise distribution, making the old consumer-versus-enterprise binary less clean.

9. The Economics: The Real Constraint Is Not “Model Quality” but Cost of Intelligence

The source says OpenAI spends roughly $2 for every $1 of revenue. That framing is too simplistic for serious analysis.

OpenAI’s financial profile is undeniably capital-intensive, but reported figures must distinguish cash spending, compute costs, operating losses, and non-cash restructuring charges.

The Financial Times reported that OpenAI generated approximately $13 billion of revenue in 2025 while spending $34 billion. It reported a $39 billion net loss, but roughly $30 billion of that was a non-cash charge related to the prior investor structure. Excluding that charge and other non-cash items, operational losses were reported at around $8 billion.

This means the simple statement “OpenAI spends $2 for every $1 earned” may capture the scale of gross cash requirements at some point, but it is not a reliable representation of ongoing operating unit economics.

The more interesting economic question is how quickly inference costs decline relative to usage growth.

Frontier AI has a structural tension:

Better models → more demand → more inference → more infrastructure spending.

If price per unit of intelligence falls faster than compute efficiency improves, revenue growth may not translate proportionally into margin expansion.

This is why custom silicon and infrastructure bargaining power matter so much.

AWS wants Trainium adoption because custom silicon can reduce dependence on NVIDIA and capture more of the economics inside AWS.

Google wants TPU scale for the same reason.

Microsoft wants OpenAI-driven Azure demand and deeper software integration.

NVIDIA wants long-duration demand visibility from the frontier labs.

The model labs want enough supplier diversity to prevent any single infrastructure provider from capturing too much of their margin.

10. The New Strategic Map: Reciprocal Dependence, Not Simple Cloud Control

The source’s broader takeaway — that hyperscalers may be the true winners — is plausible but incomplete.

Hyperscalers clearly occupy a privileged position because they control data-center footprints, power procurement, networking, cloud distribution, enterprise relationships, and increasingly custom silicon.

But frontier labs also possess leverage.

A leading model company can move enormous volumes of compute procurement, validate a new chip architecture, attract cloud customers, strengthen an enterprise AI platform, and create equity gains for strategic investors.

This creates reciprocal dependence.

Consider AWS and Anthropic.

Anthropic needs AWS infrastructure. But AWS also uses Anthropic as the flagship proof point for Trainium. Project Rainier and more than one million Trainium2 chips give Amazon a reference customer at a scale few others can provide. Anthropic therefore helps AWS validate a strategic attempt to reduce dependence on NVIDIA.

Likewise, OpenAI’s 2 GW Trainium commitment is strategically important to AWS’s custom-silicon business.

The model companies are not merely buyers. They are anchor tenants for an emerging AI industrial infrastructure.

11. Capital Is Becoming Part of the Compute Contract

A striking feature of the current market is the increasing overlap between investor and supplier roles.

Microsoft is both a major OpenAI shareholder and infrastructure partner.

Amazon is both a major Anthropic shareholder and Anthropic’s primary cloud provider. It is now also a $50 billion OpenAI investor and major OpenAI compute supplier.

Google is an Anthropic investor and TPU/cloud partner.

NVIDIA invests in both model companies while also supplying the accelerators on which much of the industry depends.

This creates a new analytical problem for investors: headline “investment” announcements cannot be evaluated independently from procurement commitments, cloud contracts, revenue-sharing agreements and supplier incentives.

A strategic investment may effectively subsidize future infrastructure consumption. A compute commitment may in turn secure capital, distribution, or silicon priority.

Therefore, future Solten & Co. deal analysis should separate at least five economic layers in AI transactions:

  1. Equity investment.
  2. Compute purchase commitments.
  3. Cloud distribution rights.
  4. IP/model licensing rights.
  5. Revenue-share or commercial participation rights.

Without separating these layers, reported transaction values can be misleading.

12. Compute Commitments Are Emerging as a Form of Strategic Debt

Long-term compute commitments are not debt in the legal accounting sense, but economically they can behave like quasi-fixed obligations.

A lab that contracts tens or hundreds of billions of dollars of future capacity is making a bet on continued demand growth, model economics, and capital availability.

This creates several risks:

Demand risk — future AI usage may grow more slowly than contracted capacity.

Price risk — compute prices may fall faster than expected, making old commitments expensive relative to market alternatives.

Technology risk — a contracted silicon architecture may become less competitive.

Capital risk — the company may need continuous financing to fund capacity before operating cash flow catches up.

Utilization risk — infrastructure economics deteriorate sharply if expensive capacity is underused.

Counterparty risk — hyperscalers and infrastructure providers become increasingly exposed to the financial health of a small group of frontier labs.

This is one of the most important areas for future investment research because the market often celebrates giant compute commitments as evidence of confidence while under-analyzing their downside asymmetry.

13. What the 2026 Market Says About Anthropic vs. OpenAI

The competitive picture changed dramatically in 2026.

Anthropic reported run-rate revenue above $30 billion in April 2026, up from approximately $9 billion at the end of 2025. Reuters reported in August 2026 that Anthropic’s annualized run rate had exceeded $65 billion by the end of July.

This is far beyond the scale implied in the source.

OpenAI remains enormous, with unmatched consumer awareness and major enterprise ambitions, but recent reporting suggests stronger competitive pressure from Anthropic in coding and enterprise workloads.

The investment lesson is not that Anthropic has definitively “won.” It is that infrastructure strategy and distribution architecture can materially affect commercial outcomes.

Anthropic’s ability to be present inside all three major cloud ecosystems reduced customer procurement friction and gave it multiple infrastructure paths.

OpenAI, initially more concentrated around Microsoft, has spent 2025–2026 building similar optionality through AWS, NVIDIA, Oracle, CoreWeave and Stargate.

The two firms are therefore converging toward a common strategic requirement: no frontier lab wants to depend on a single source of capital, compute, or distribution.

14. What to Watch Next — Investor Monitoring Framework

For investors analyzing frontier AI, cloud infrastructure or adjacent companies, the following metrics may now be more informative than benchmark leadership alone.

Infrastructure concentration

What percentage of training and inference depends on each provider?

Committed capacity

How much future compute, power, and data-center capacity is contractually committed?

Compute economics

What is the effective cost per training run, per inference token or per unit of delivered intelligence?

Silicon mix

How exposed is the company to NVIDIA versus Trainium, TPU or other accelerators?

Distribution breadth

Can the company sell through AWS, Azure, Google Cloud, and directly?

Revenue concentration

How dependent is growth on consumers, coding tools, API use or a small number of enterprise customers?

Capital dependency

How much external funding is required before free cash flow becomes plausible?

Strategic investor overlap

Are suppliers also shareholders? Do those relationships distort apparent pricing or economics?

Contract flexibility

Can the company shift workloads across providers when technology or economics change?

Infrastructure utilization

Are contracted gigawatts translating into monetized demand?

15. Solten & Co. View

The frontier AI market is evolving from a software race into an industrial system.

That system has at least six tightly coupled layers:

Capital → Power/Data Centers → Silicon → Cloud Infrastructure → Frontier Models → Applications/Distribution.

The key strategic question is no longer only who has the best model.

It is who can secure sufficient capital and infrastructure without surrendering too much economics or strategic flexibility to the companies supplying that infrastructure.

OpenAI’s 2025–2026 evolution is a case study in reducing dependency. Microsoft remains central, but OpenAI has steadily expanded into AWS, NVIDIA, and other infrastructure partners while renegotiating exclusivity.

Anthropic is a case study in diversified infrastructure from an earlier stage. AWS remains primary, but Anthropic has systematically maintained access to multiple clouds and silicon architectures.

The hyperscalers are likely to capture enormous value because the frontier-model boom drives cloud demand, custom-silicon adoption and enterprise AI distribution. But the idea that they will automatically own the economics is too simple.

The more likely equilibrium is a small number of frontier labs and infrastructure giants locked in reciprocal dependence, each attempting to diversify enough to preserve bargaining power.

For investors, the most underappreciated layer may be the contracts connecting them.

Those contracts — compute commitments, distribution rights, strategic investments, revenue shares and silicon partnerships — increasingly determine which companies have flexibility, which carry hidden obligations, and where economic value ultimately accrues.

Fact-Check: Selected Claims from the Source

Claim: Microsoft owns approximately 26–30% of OpenAI, worth about $135B.

Status: Substantially verified. Microsoft disclosed roughly 27%, valued at approximately $135B after the October 2025 recapitalization.

Claim: Microsoft receives roughly 20% of OpenAI revenue through 2030.

Status: Historically supported by reporting; the 2026 amended agreement kept the same percentage through 2030 but added a total cap. Reuters later reported the cap at approximately $38B.

Claim: OpenAI receives roughly 20% of Azure OpenAI/Bing AI revenue.

Status: Reciprocal revenue sharing existed historically, but this is now outdated. Microsoft said in April 2026 that it would no longer pay a revenue share to OpenAI.

Claim: OpenAI committed to purchase $250B of Azure services.

Status: Verified as an October 2025 incremental Azure commitment. However, the broader relationship has since changed materially, and OpenAI has added very large AWS and NVIDIA commitments.

Claim: Microsoft has exclusive API distribution rights until AGI.

Status: Outdated. This described the earlier structure. The April 2026 amendment materially relaxed exclusivity and made Microsoft’s IP license non-exclusive, while OpenAI gained the ability to serve products through other clouds.

Claim: Anthropic has approximately $50B in compute commitments across providers.

Status: Outdated. Anthropic’s 2026 commitments expanded far beyond this number, including more than $100B committed to AWS alone over ten years, multi-gigawatt Google capacity, $30B of Azure capacity and additional GPU infrastructure.

Claim: Anthropic uses up to 1M Google TPUs and around 1 GW of Google capacity.

Status: Verified as the October 2025 announced plan. The Google/Broadcom relationship expanded again in April 2026 into multiple gigawatts of next-generation TPU capacity.

Claim: Amazon invested $8B in Anthropic and AWS is its primary cloud provider.

Status: Verified historically. Amazon’s total investment has since increased, and AWS remains Anthropic’s primary cloud and training provider.

Claim: Anthropic is available through AWS Bedrock, Google Vertex AI and Azure Foundry.

Status: Verified. Anthropic describes Claude as the only frontier AI model available across all three major cloud platforms.

Claim: OpenAI is ~73% consumer revenue and Anthropic ~85% B2B API revenue.

Status: Directionally plausible but not sufficiently supported at those exact percentages by primary evidence reviewed. Reuters reported roughly 30% enterprise revenue for OpenAI in late 2025 and consistently described Anthropic growth as enterprise-led. Exact percentages should not be used without a dated underlying source.

Claim: OpenAI spends roughly $2 for every $1 of revenue.

Status: Oversimplified. OpenAI is highly cash-intensive, but reported losses include major non-cash items and changing compute economics. Use specific period financial data instead of a permanent ratio.

Primary and High-Quality Sources

Microsoft — The next chapter of the Microsoft–OpenAI partnership, Oct. 28, 2025

https://blogs.microsoft.com/blog/2025/10/28/the-next-chapter-of-the-microsoft-openai-partnership/

OpenAI — Our Structure

https://openai.com/our-structure/

OpenAI/Microsoft — Joint Statement, Feb. 27, 2026

https://openai.com/index/continuing-microsoft-partnership/

Microsoft — The next phase of the Microsoft–OpenAI partnership, Apr. 27, 2026

https://blogs.microsoft.com/blog/2026/04/27/the-next-phase-of-the-microsoft-openai-partnership/

Reuters — OpenAI/Microsoft revenue-share cap report, May 12, 2026

https://www.reuters.com/technology/openai-cap-microsoft-revenue-sharing-38-billion-information-reports-2026-05-12/

OpenAI — AWS and OpenAI multi-year strategic partnership, Nov. 3, 2025

https://openai.com/index/aws-and-openai-partnership/

OpenAI — OpenAI and Amazon strategic partnership, Feb. 27, 2026

https://openai.com/index/amazon-partnership/

OpenAI — Scaling AI for everyone, Feb. 27, 2026

https://openai.com/index/scaling-ai-for-everyone/

OpenAI — Frontier models and Codex available on AWS, Jun. 1, 2026

https://openai.com/index/openai-frontier-models-and-codex-are-now-available-on-aws/

Anthropic — Powering the next generation of AI development with AWS, Nov. 22, 2024

https://www.anthropic.com/news/anthropic-amazon-trainium

Anthropic — Expanding our use of Google Cloud TPUs and Services, Oct. 23, 2025

https://www.anthropic.com/news/expanding-our-use-of-google-cloud-tpus-and-services

Anthropic — Microsoft, NVIDIA and Anthropic strategic partnerships, Nov. 2025

https://www.anthropic.com/news/microsoft-nvidia-anthropic-announce-strategic-partnerships

Anthropic — Google/Broadcom next-generation compute expansion, Apr. 6, 2026

https://www.anthropic.com/news/google-broadcom-partnership-compute

Anthropic — Amazon compute expansion, Apr. 20, 2026

https://www.anthropic.com/news/anthropic-amazon-compute

Anthropic — Higher limits and SpaceX compute partnership, 2026

https://www.anthropic.com/news/higher-limits-spacex

Reuters — Anthropic annualized revenue reached $3B on business demand, May 30, 2025

https://www.reuters.com/business/anthropic-hits-3-billion-annualized-revenue-business-demand-ai-2025-05-30/

Reuters — Anthropic revenue run rate tops $65B, Aug. 17, 2026

https://www.reuters.com/technology/anthropic-revenue-run-rate-tops-65-billion-source-says-2026-08-17/

Financial Times — OpenAI spending hit $34B in 2025

https://www.ft.com/content/e15b0d7e-ff6b-4f16-ba7a-4068feddb828

Evidence & Publication Note

Publication-ready research report. The analysis separates disclosed facts, externally reported terms, and Solten & Co. interpretation, and includes original research exhibits covering selected compute capacity, partnership structure, and the evolution toward multi-provider infrastructure portfolios.

Research Exhibits

Exhibit 1 — Selected Announced Frontier-Lab Compute Capacity

The figures below capture disclosed capacity announcements, not directly comparable installed capacity. Timing, silicon, workload type, and “up to” language differ materially across agreements.

Exhibit 2 — AI Strategic Partnerships Are Multi-Layer Transactions

The same counterparty can simultaneously be an investor, compute supplier, distributor, model-access partner and commercial beneficiary. This is why headline investment values alone are poor representations of the underlying economics.

Exhibit 3 — From Bilateral Cloud Partnerships to Multi-Provider Infrastructure Portfolios

The chronology shows the strategic shift from relatively concentrated bilateral relationships toward overlapping networks of capital, compute, and distribution.

Methodological Note

These exhibits are based on disclosed company announcements and high-quality reporting available through August 20, 2026. They intentionally avoid converting unlike commitments into a single headline value. Gigawatts describe capacity; dollars describe investments or contractual purchase obligations; neither is equivalent to realized utilization or economic value. Where terms are described as “up to,” the chart retains that qualification in the underlying analysis.

Etched: The $21 Billion Bet on Specialized AI Inference

What a $700 million financing round reveals about the economics of inference, the limits of GPU generality, and the emerging contest to reshape AI infrastructure

Solten Deal Analysis 
Published / updated: August 20, 2026 
Research universe: AI Infrastructure / Semiconductors / Capital & Deals

Research Passport

Company: Etched
Headquarters: San Jose, California
Founded: 2022
Founders: Gavin Uberti, Robert Wachen, Chris Zhu

Transaction: $700 million financing
Announced valuation: $21 billion
Date announced: August 18, 2026
Lead investor: Jane Street
Other disclosed participants: Kleiner Perkins, Sequoia, Andreessen Horowitz, Tiger Global, Bain Capital Ventures, Neo, Primary, Stripes, Positive Sum, and Blackstone

Company-stated total funding: $1.9 billion
Evidence cut-off: August 20, 2026
Research type: Deal Analysis
Estimated reading time: ~35 minutes

Executive Summary


Etched’s latest financing is not interesting primarily because a three-year-old semiconductor company raised $700 million. It is interesting because investors are assigning a $21 billion value to a company whose commercial history is still extremely short, whose first customer rack was delivered only last month, whose publicly identified customer base remains minimal, and whose most important performance claims are not yet supported by broad independent benchmark evidence.


At the same time, dismissing the valuation as simple AI exuberance misses what investors may actually be underwriting. Etched sits at the intersection of several powerful structural forces: inference is becoming the dominant recurring compute burden in AI; model-serving economics increasingly depend on tokens per dollar and tokens per watt; hyperscalers and model labs are actively seeking alternatives to a single-vendor GPU stack; and the AI infrastructure market is beginning to reward systems designed around specific workload economics rather than general-purpose programmability.


The company has also changed materially. In 2024 Etched publicly presented itself as a radical transformer-only ASIC company. The proposition was intentionally narrow: hardwire the dominant model architecture into silicon and sacrifice generality for extraordinary efficiency. By mid-2026, Etched’s public positioning had broadened into “frontier inference clusters” — co-designed chips, memory, interconnect, racks, cooling, software and manufacturing. Its current materials emphasize Low Voltage Inference and Cluster Scale Memory, and the company says its systems can run large mixture-of-experts and non-transformer designs. That evolution reduces one of the original thesis risks, but also means the company should no longer be analyzed simply as “the transformer ASIC startup.”


The current round contains an unusually strong strategic signal: Jane Street is simultaneously the lead investor and Etched’s first disclosed customer. Jane Street says it tested the chip, received the first rack in July and is deploying it in production workloads. This matters because Jane Street is not a passive financial sponsor. Earlier in 2026 it committed approximately $6 billion to CoreWeave for AI cloud capacity and invested $1 billion in CoreWeave equity. Its investment in Etched is therefore consistent with a broader strategy of controlling access to high-performance compute for latency- and research-intensive workloads.


The central valuation question is severe. A $21 billion entry valuation means that, before accounting for future dilution or preference terms, investors need an eventual company value of roughly $42 billion for 2x, $63 billion for 3x and $105 billion for 5x. If Etched experiences 20% future dilution, those thresholds rise to roughly $52.5 billion, $78.8 billion and $131.3 billion. This is not impossible in a market as large as AI infrastructure, but it requires Etched to become much more than a successful chip startup. It likely requires the company to establish a durable platform position in large-scale inference, capture significant system-level economics, and survive successive NVIDIA and hyperscaler product cycles.


The strongest Solten & Co. interpretation is that the Etched round is an early institutional bet on a market structure in which inference fragments away from a universal GPU architecture. The strongest counter-thesis is that NVIDIA’s software ecosystem, scale, systems integration, pace of product improvement and financing power continue to compress the available window for specialized challengers faster than Etched can convert technical advantage into a durable commercial moat.


Key Findings


  1. The $700 million round is best understood as a bet on the future structure of inference, not simply on one chip. Etched is attempting to own an integrated inference system spanning silicon, memory, interconnect, racks, cooling, software and production.


  1. The valuation has moved much faster than publicly demonstrated commercial maturity. Etched went from a reported $5 billion post-money valuation in December 2025 to $10.3 billion in July 2026 and $21 billion in August 2026. The latest valuation more than doubled in less than one month.


  1. Jane Street is the most strategically important participant in the round because it is both lead investor and first disclosed customer. That dual role provides stronger demand validation than a conventional venture syndicate, but also introduces concentration and signaling questions.


  1. The company’s “more than $1 billion in customer contracts” is meaningful evidence of demand, but it is not equivalent to recognized revenue, recurring revenue or even necessarily fully binding backlog. Public disclosure remains insufficient to determine contract quality, customer concentration, delivery schedules or gross-margin economics.


  1. Etched’s product thesis has broadened materially since 2024. The original transformer-only framing exposed the company to architecture obsolescence. The 2026 system is presented as a broader inference platform using Low Voltage Inference and Cluster Scale Memory and is said to run MoE and non-transformer designs.


  1. NVIDIA remains the reference competitor, but Etched’s real competitive set is wider: NVIDIA, AMD, Google TPU, AWS Trainium, Microsoft Maia, Meta MTIA, Cerebras and other specialized inference architectures. The market is evolving toward heterogeneous compute rather than a simple NVIDIA-versus-startup contest.


  1. The deal is strategically important for the semiconductor ecosystem because success would validate a merchant specialized-inference business model distinct from both general-purpose GPUs and vertically integrated hyperscaler ASICs.


  1. The most important unresolved question is no longer whether Etched can produce working silicon. It can. The question is whether it can repeatedly manufacture, deploy and support systems at scale while delivering independently verifiable cost, latency and power advantages after software, networking, utilization and customer migration costs are included.


Table of Contents


Executive Summary

Key Findings

Why This Deal Matters

Scope & Methodology

The Company: From Transformer ASIC to Frontier Inference Systems

What Etched Actually Builds

Manufacturing and Production Strategy

Commercial Evidence: $1 Billion in Contracts Is Not $1 Billion in Revenue

Jane Street: Why the Lead Investor Matters

Financing History

Current Transaction Anatomy

Valuation: What Must Be True at $21 Billion

The Investor Coalition

Competitive Landscape

Market Structure: The Inference Economy Is Becoming Its Own Industry

Industry Impact: First-, Second- and Third-Order Effects

Broader Economic Implications

Risks to Etched

Risks to Investors

Risks to the Industry

Scenario Analysis

Solten & Co. Thesis

Counter-Thesis

Falsification Criteria

Key Unknowns

What to Watch Next

Research Exhibits

Sources & Evidence

Methodological Note

About Solten & Co.


Scope & Methodology


Research question. This report asks what Etched’s August 2026 financing reveals about the company’s emerging business, the economics of specialized AI inference, investor expectations embedded in a $21 billion valuation, and the likely competitive effects on the broader AI infrastructure market.


Scope. The analysis covers Etched’s corporate history, product evolution, disclosed financing history, current investor coalition, customer evidence, valuation implications, competitive landscape, industry structure and potential first-, second- and third-order effects. It is not a full technical audit of Etched silicon and does not constitute an investment recommendation.


Evidence hierarchy. Priority is given to Etched disclosures, official investor and partner statements, SEC filings and other primary sources. Reuters, TechCrunch and other high-quality specialist reporting are used where private-company terms are not publicly disclosed. Academic accelerator research is used to test the general validity of performance comparisons.


Evidence cut-off. August 20, 2026.


Material limitations. Etched is private. Detailed financial statements, cap-table data, preferred-stock terms, production yields, customer contracts, pricing, gross margins and normalized third-party benchmark results are not publicly available. Therefore ownership, return and valuation analyses are explicitly illustrative where required.


Evidence classes. DISCLOSED FACT identifies primary-source facts. REPORTED TERM identifies credible but externally reported information. ESTIMATE identifies calculations based on incomplete public data. SOLTEN & CO. INTERPRETATION identifies analytical synthesis.


What Changed


Etched is no longer best understood through its original 2024 description as a transformer-only chip company. Its public 2026 strategy has moved upward in the stack toward complete frontier inference systems and toward a broader architecture story built around Low Voltage Inference and Cluster Scale Memory. The company now says its systems are running massive MoE models and non-transformer designs.


The commercial evidence has also changed. In June, the company had working silicon and more than $1 billion in customer contracts but no disclosed production customer. By August, Jane Street had received the first rack and was actively deploying it. This materially improves the evidence base, although it does not resolve questions around normalized performance, contract quality, revenue conversion or margins.


The financing context changed just as quickly. Etched’s valuation moved from $5 billion in the financing disclosed for December 2025 to $10.3 billion in July 2026 and $21 billion in August. The market is therefore not merely rewarding technical execution; it is rapidly capitalizing an expected future position in the inference value chain.


Why This Deal Matters


Etched announced on August 18 that it had raised $700 million at a $21 billion valuation in a round led by Jane Street. The company said the financing included Kleiner Perkins, Sequoia, Andreessen Horowitz, Tiger Global, Bain Capital Ventures, Neo, Primary, Stripes, Positive Sum and Blackstone. It also disclosed that Jane Street was its first customer, had received the company’s first shipped rack in July and was actively deploying the system.


This financing deserves attention for three reasons.


First, the speed of valuation expansion is extreme even by current AI standards. Etched was valued at $10.3 billion in a $300 million Series C announced July 23. Less than four weeks later, the valuation was $21 billion. That is approximately a 104% increase in headline valuation in 26 days.


Second, the round arrives at the moment Etched is crossing the line from technical promise to commercial execution. The company emerged from stealth in June with working A0 silicon on TSMC N4P, a team of more than 400, over $1 billion in customer contracts and a plan to ship its first racks during the summer. By August, the first disclosed rack had reached Jane Street. The investment therefore prices not merely a design concept but a very early production system.


Third, the deal tests a larger industry hypothesis: whether the economics of AI inference are now large enough to support highly specialized merchant hardware companies alongside GPUs and hyperscaler custom silicon.


The Company: From Transformer ASIC to Frontier Inference Systems


Etched was founded in 2022 by Gavin Uberti, Robert Wachen and Chris Zhu, three Harvard dropouts who later became Thiel Fellows. Early reporting described Uberti and Zhu as the technical founders; by 2024, Primary Venture Partners publicly described all three as co-founders.


Uberti’s background includes compiler work and development of a Cortex-M backend for TVM. Zhu has a mathematics and high-performance-computing background. Wachen’s role has been more commercially oriented. Etched’s current leadership team has been deliberately built around experienced semiconductor operators, including former Cypress CTO Mark Ross, former NVIDIA platform leader Brian Loiler, former NVIDIA/Auradine architect Saptadeep Pal, former Google TPU software leader David Munday and production executives with experience in high-volume consumer hardware.


This composition matters because semiconductor startups often fail not at architecture design but at production, packaging, supply, system validation, developer tooling and customer deployment. Etched’s hiring strategy appears designed to close precisely that execution gap.


The original product thesis was unusually simple and unusually risky. In 2024 the company described Sohu as an ASIC designed specifically for transformer inference. CEO Gavin Uberti openly acknowledged the binary nature of the bet: if transformers disappeared, the company’s original architecture would be impaired; if they remained dominant, specialization could create a major performance advantage.


By 2026, however, the public product definition had changed. Etched no longer leads with Sohu or with a “transformer-only” identity. Its current category is “frontier inference clusters.” The company says it co-designs chips, racks, software and manufacturing methods to optimize throughput, latency, cost and power efficiency across both prefill and decode workloads.


That shift is strategically significant. It suggests Etched is moving from an architecture-specific chip thesis to a system-level inference thesis.


What Etched Actually Builds


Etched’s current system claims two central technical differentiators.


Low Voltage Inference (LVI). Etched argues that conventional AI chips cannot sustain peak floating-point throughput because power draw and thermal limits force clock reductions. Its architecture is designed to run math blocks at materially lower voltage, allowing higher compute density within a fixed power envelope. The company says this enables large sparse mixture-of-experts models to operate at over 80% of peak FLOPS without thermal throttling.


Cluster Scale Memory (CSM). Etched argues that decode workloads are frequently constrained by memory access and inter-chip communication rather than raw FLOPS. Its system combines HBM and SRAM with a proprietary interconnect to create a lower-latency shared memory pool across a scale-up domain. The intended effect is to reduce the trade-off between high-capacity HBM systems and very fast but capacity-limited SRAM-centric designs.


These are company claims, not independent performance conclusions. The company has not yet published a broad third-party benchmark suite that allows investors to normalize performance across batch size, context length, model architecture, precision, concurrency, power, rack configuration and software stack.


That absence is currently one of the most important analytical constraints.


Independent academic work on AI accelerators reinforces why such normalization matters. A 2026 comparative study of NVIDIA, AMD, Cerebras, SambaNova, Gaudi and TPU systems found that the optimal hardware platform varies significantly with model size, sequence length, batch size and workload characteristics. It also found that high utilization is critical to realizing energy-efficiency benefits. A headline tokens-per-second figure therefore does not by itself establish superior production economics.


Manufacturing and Production Strategy


Etched’s first A0 silicon returned from TSMC on the N4P process in early 2026. The company says it achieved first-pass silicon success in under three years from its seed round.


It has also chosen a higher degree of operational integration than many fabless semiconductor startups. Etched says it has opened a Taiwan factory, built a data center, test house and NPI prototyping lab in San Jose, and opened an approximately 80,000-square-foot facility near its headquarters to accelerate production and prototyping. It describes “production is the product” as an operating principle.


This strategy has two interpretations.


The positive interpretation is that Etched understands the commercialization bottleneck. A custom AI accelerator is not useful merely because the chip works. Customers buy complete systems, qualification, networking, thermals, firmware, software and reliable supply. Vertical integration may let Etched iterate faster and reduce the hand-offs that slow traditional semiconductor development.


The counterpoint is capital intensity. Bringing more system design, validation and manufacturing processes inside the company increases fixed costs, working-capital needs and organizational complexity. The $700 million round therefore appears partly designed to finance an industrial scaling problem, not just semiconductor R&D.


Commercial Evidence: $1 Billion in Contracts Is Not $1 Billion in Revenue


Etched says it has secured more than $1 billion in customer contracts across public and private frontier AI companies and cloud providers. The current announcement adds one major validation point: Jane Street is now a named customer with a rack physically deployed.


This is meaningful progress. In June, outside reporting correctly noted that Etched had not publicly named customers, disclosed contract terms or provided independent performance benchmarks. By August, one customer had moved from anonymous demand to actual deployment.


But the public data still leave major diligence gaps.


We do not know:


  • how much of the $1 billion is binding purchase commitments versus reservations, milestones or conditional orders;
  • how concentrated the contracts are among a small number of customers;
  • the delivery schedule;
  • cancellation rights;
  • gross margin on initial systems;
  • recognized revenue to date;
  • how much revenue depends on customer acceptance testing;
  • whether contracts cover chips, racks, services or future generations;
  • how much capital Etched must spend before it can recognize the contracted revenue.


This distinction is critical because the company’s $21 billion valuation is roughly 21 times the headline $1 billion contract figure. That is not a revenue multiple. It should not be treated as one.


The correct interpretation is that investors are valuing expected future economics far beyond currently disclosed commercial realization.


Jane Street: Why the Lead Investor Matters


Jane Street is unusually important to the Etched story.


It is not simply a hedge fund or a venture investor adding an AI hardware position. Jane Street is one of the world’s most technology-intensive trading firms. Its core business rewards extremely high-performance research and computation, and it has become a major direct buyer of AI infrastructure.


In April 2026, Jane Street committed approximately $6 billion to CoreWeave for AI cloud capacity across multiple facilities, including NVIDIA Vera Rubin technology, and separately invested $1 billion in CoreWeave equity. Reuters described the transaction as part of Jane Street’s broader effort to scale machine learning across its global markets research.


That makes Jane Street’s Etched investment much more informative than a conventional VC endorsement. Jane Street has access to NVIDIA-based infrastructure through CoreWeave, has the technical capacity to evaluate alternatives, and has an economic incentive to improve inference performance for highly latency-sensitive and compute-intensive workloads.


According to Etched, Jane Street tested the chip before leading the round and is now running a rack in its own data center.


This creates a powerful proof point — but it also requires analytical caution.


Jane Street is simultaneously customer, investor and signal provider. Those roles can reinforce each other. A customer that owns equity may tolerate early product friction or adopt infrastructure partly because it expects strategic upside. Conversely, the fact that Jane Street already has access to large-scale NVIDIA systems makes its decision to deploy Etched more significant, not less.


The most useful conclusion is therefore not “Jane Street proves Etched wins.” It is that a technically sophisticated, capital-rich buyer with access to alternative infrastructure believes Etched is sufficiently credible to test in production and sufficiently valuable to lead a major financing.


Financing History


March 2023 — Seed

Etched raised approximately $5.4 million at a reported $34 million valuation. Reuters later confirmed the valuation when covering the Series A.


June 2024 — Series A

Etched raised $120 million, co-led by Primary Venture Partners and Positive Sum. The round included Peter Thiel and a long list of technology founders and investors. The company said the capital would support chip development and manufacturing. A company-level valuation was not publicly disclosed at the time.


December 2025 / disclosed June 2026 — $500 million financing

When Etched emerged from stealth, it disclosed that its latest prior financing had been $500 million at a $5 billion post-money valuation. It also said it had raised $800 million across multiple unannounced financings by that point.


July 23, 2026 — Series C

Etched raised $300 million at a $10.3 billion valuation. Sequoia led, with Andreessen Horowitz, Jane Street, Diffusion and SK Hynix among participants. The company said proceeds would accelerate production and customer deployments.


August 18, 2026 — $700 million round

Jane Street led at a $21 billion valuation, joined by Kleiner Perkins, Sequoia, Andreessen Horowitz, Tiger Global, Bain Capital Ventures, Neo, Primary, Stripes, Positive Sum and Blackstone.


Etched’s current announcement says the company has raised $1.9 billion in total. Publicly identifiable round amounts do not reconcile perfectly to that figure because several financings were never individually announced and historical totals were rounded. This is a useful example of why venture funding databases should not be treated as primary evidence when the company itself describes undisclosed rounds.


Current Transaction Anatomy


DISCLOSED FACT: Etched raised $700 million at a $21 billion valuation.


DISCLOSED FACT: Jane Street led the round.


DISCLOSED FACT: Kleiner Perkins, Sequoia, Andreessen Horowitz, Tiger Global, Bain Capital Ventures, Neo, Primary, Stripes, Positive Sum and Blackstone participated.


UNKNOWN: Whether the $21 billion figure is explicitly pre-money or post-money in the legal financing documents. Public coverage generally presents it as the round valuation without disclosing the security terms.


UNKNOWN: Secondary component, if any.


UNKNOWN: Liquidation preference, participation rights, anti-dilution protection, board rights and other preferred-stock terms.


ESTIMATE: If $21 billion is a post-money valuation and the entire $700 million is primary equity, the round would represent approximately 3.3% of post-money ownership before other option-pool or security effects. This is only an illustrative estimate and should not be treated as a disclosed cap-table fact.


The striking point is that Etched is raising large absolute amounts with relatively modest headline dilution because valuation has accelerated so quickly.


Valuation: What Must Be True at $21 Billion


A $21 billion private valuation changes the analytical standard. At this level, the central question is no longer whether Etched can become a meaningful semiconductor company. It is whether Etched can become a very large infrastructure platform.


Ignoring future dilution, new investors require approximately:


  • $42 billion eventual equity value for a 2x gross multiple;
  • $63 billion for 3x;
  • $105 billion for 5x.


With 20% future dilution, the required exit values increase to approximately:


  • $52.5 billion for 2x;
  • $78.8 billion for 3x;
  • $131.3 billion for 5x.


Those values are possible only if Etched reaches a scale comparable with major public semiconductor or infrastructure companies.


Because current recognized revenue is not publicly disclosed, conventional revenue-multiple analysis is impossible. The $1 billion-plus contract figure is insufficient because contract value, recognized revenue, gross margin and duration are unknown.


A more useful valuation framework is therefore milestone-based.


To support the current valuation, Etched likely needs to demonstrate several of the following simultaneously:


  1. Production-scale reliability across multiple customers.
  2. Independent evidence of superior total cost of ownership on important frontier inference workloads.
  3. A software and deployment layer that makes migration materially easier than adopting a typical custom ASIC.
  4. Multi-generation product execution, not a single architecture win.
  5. A sufficiently large customer base to prevent Jane Street or any one AI lab from dominating revenue.
  6. Gross margins consistent with attractive merchant semiconductor or integrated-system economics.
  7. Access to foundry, advanced packaging and memory supply at scale.
  8. Continued relevance as model architectures evolve.
  9. A market large enough for both hyperscaler custom silicon and merchant specialized systems.
  10. Evidence that NVIDIA cannot eliminate Etched’s cost/performance advantage through rapid platform iteration or pricing.


The Investor Coalition


The syndicate tells its own story.


Jane Street brings customer validation and direct experience buying large-scale compute.


Sequoia led the July Series C and returned immediately in the August financing. Its follow-on participation is a strong signal of continued conviction after receiving access to non-public diligence during the prior round.


Andreessen Horowitz is another repeat investor, reinforcing the view that Etched is being underwritten as a major AI infrastructure platform rather than a conventional semiconductor startup.


Kleiner Perkins is notable because its managing partner publicly framed the opportunity around inference economics — specifically tokens per dollar and tokens per watt. The firm also has exposure across AI labs and infrastructure companies, giving it a broad view of demand.


SK Hynix, which participated in the July round, is strategically relevant as a major memory supplier even though it was not named in the August investor list. Its presence in the cap table illustrates how Etched’s financing network intersects with the semiconductor supply chain.


VentureTech Alliance, a fund linked to the semiconductor ecosystem and disclosed in earlier financings, further deepens the strategic investor layer.


The broader coalition — Blackstone, Tiger Global, Bain Capital Ventures, trading firms and major technology angels — suggests that Etched has moved beyond early venture financing into crossover-style capital formation.


Competitive Landscape


Exhibit 4 — The Competitive Battlefield Is Not Simply Etched vs. NVIDIA
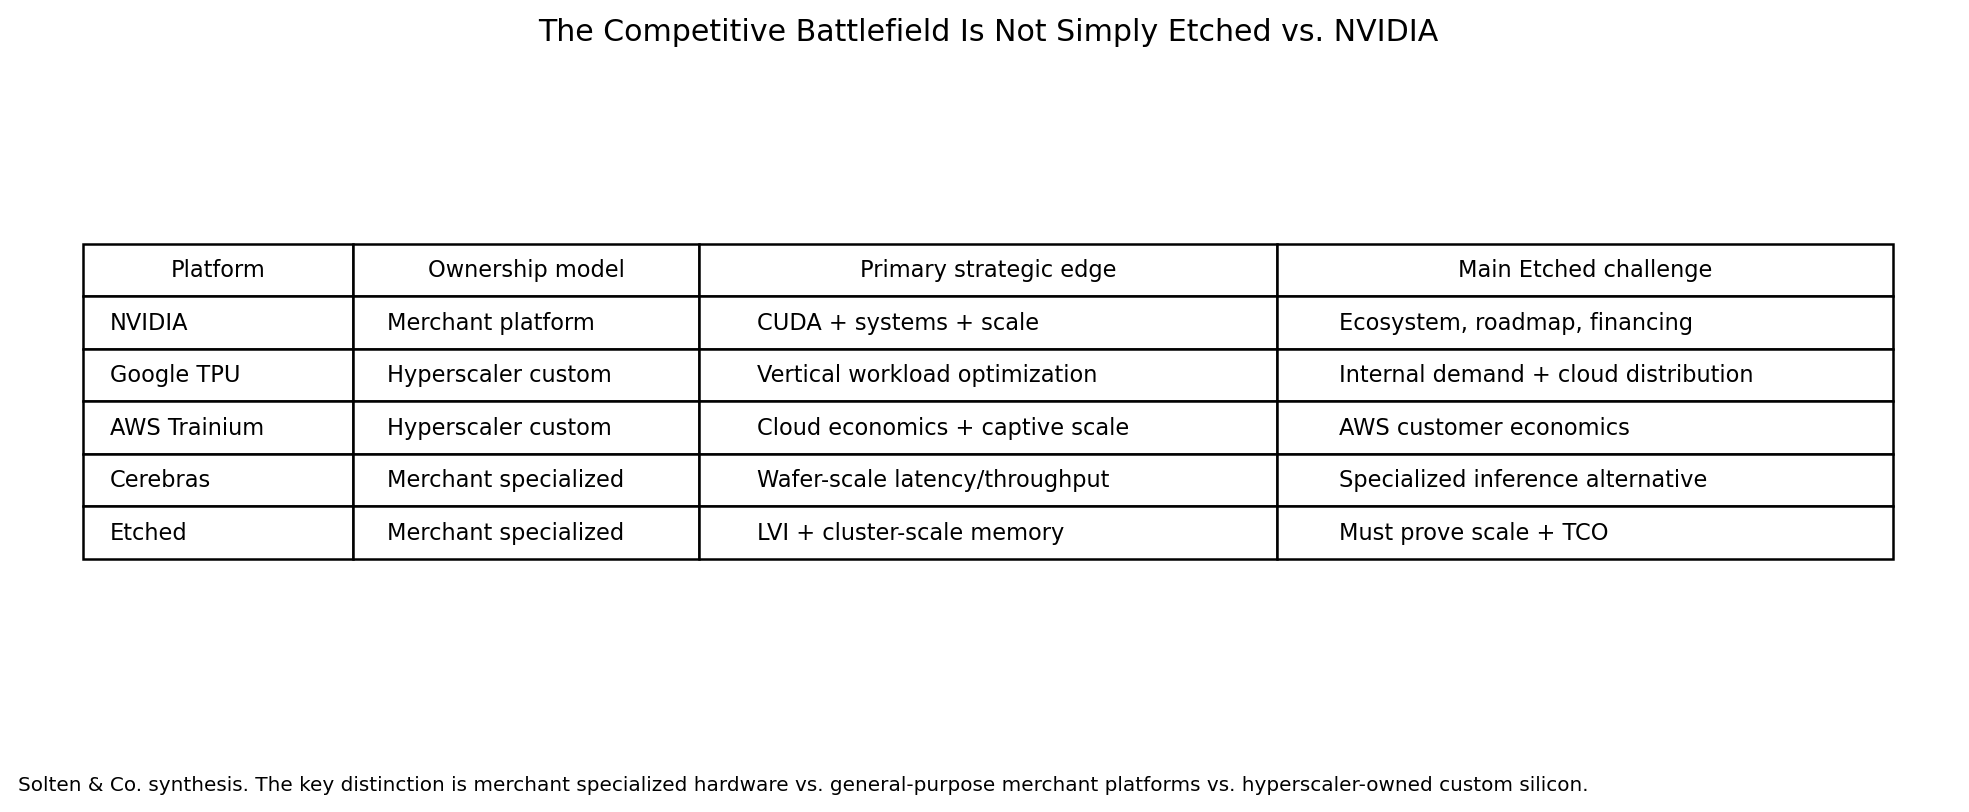
This framework separates merchant general-purpose platforms, hyperscaler-owned custom silicon and merchant specialized architectures. Etched’s strategic opening exists only if a meaningful customer segment wants hyperscaler-like specialization without owning a hyperscaler-scale internal silicon program.


The lazy framing is “Etched versus NVIDIA.” The real market is more complicated.


NVIDIA remains the dominant reference platform because it combines high-performance accelerators with CUDA, networking, systems, enterprise software, developer tooling, financing relationships and an enormous installed base. NVIDIA reported fiscal 2026 revenue of approximately $216 billion, with data-center growth driven by AI. Its gross margins remain above 70%, which demonstrates the economic value of platform control.


But NVIDIA is facing competition from several directions.


Hyperscaler custom silicon. Google TPUs, AWS Trainium, Microsoft Maia and Meta MTIA are increasingly important because the largest buyers have enough workload volume to justify architecture-specific optimization. Google and Broadcom have extended TPU collaboration through 2031, and Google is expanding external TPU distribution. AWS has made Trainium central to major OpenAI and Anthropic compute relationships.


Merchant accelerators. AMD remains the largest conventional GPU alternative. Cerebras uses wafer-scale processors and is explicitly targeting fast inference. Its newly announced CS-4 system illustrates how quickly the specialized-inference market is moving.


Specialized architectures. Groq demonstrated demand for low-latency inference and ultimately entered a major technology relationship with NVIDIA, a reminder that incumbent responses can include acquisition, licensing and ecosystem absorption rather than only price competition.


Other startups and new architectures. Tenstorrent, SambaNova, d-Matrix, Furiosa and others continue to pursue different combinations of programmability, memory architecture, inference efficiency and system design.


Etched is therefore competing on multiple dimensions:


  • tokens per dollar;
  • tokens per watt;
  • latency;
  • throughput;
  • programmability;
  • model compatibility;
  • memory capacity and bandwidth;
  • interconnect performance;
  • rack-level deployment complexity;
  • supply availability;
  • software maturity;
  • customer switching cost;
  • production scale.


The important market question is not whether one architecture wins universally. Independent accelerator research increasingly suggests that workload characteristics determine the optimal hardware. The likely market structure is heterogeneous.


Etched’s opportunity is to own a sufficiently valuable portion of that heterogeneity.


Market Structure: The Inference Economy Is Becoming Its Own Industry


The shift from training to inference is central to the Etched thesis.


Training creates frontier capability, but inference monetizes that capability. Every user query, coding-agent step, enterprise workflow and autonomous tool call creates recurring inference demand. As agentic systems perform longer reasoning chains and call other models or software repeatedly, the number of inference operations per unit of useful work can rise dramatically.


NVIDIA itself now describes inference as the dominant AI workload. The company’s fiscal 2026 annual materials state that inference has overtaken training as the primary workload and emphasize the changing economics of AI as models move into large-scale use.


This shift matters because inference rewards different optimization choices than training.


Training values flexibility, enormous distributed scale and rapid support for new model operations.


Inference can reward specialization when workloads are repeated at high volume. Once a model architecture is stable enough, purpose-built silicon can theoretically remove general-purpose overhead and optimize memory, scheduling and power around the real workload.


That creates a structural opening for companies like Etched.


But the same economics also motivate every hyperscaler to build custom silicon internally. Etched must therefore prove that a merchant specialized platform can compete not only with NVIDIA but with customers’ own chips.


Industry Impact: First-, Second- and Third-Order Effects


First-order effect: more credible competition in inference accelerators.


A working Etched system with a production customer increases pressure on NVIDIA and other accelerator vendors to compete on inference-specific economics rather than only headline training performance. It also gives AI labs and cloud providers another procurement option.


Second-order effect: greater bargaining power for large compute buyers.


Even if Etched never takes dominant market share, credible alternatives can influence NVIDIA pricing, supply terms and roadmap priorities. Large buyers gain leverage when they can move marginal inference workloads to specialized systems.


Second-order effect: more fragmentation in the software stack.


Every new accelerator creates integration cost. Model runtimes, compilers, kernels, observability, orchestration and deployment tooling must support heterogeneous systems. This creates opportunity for software layers that abstract hardware differences — but also raises switching costs for customers.


Second-order effect: more pressure on custom silicon economics.


If Etched can offer hyperscaler-like specialization without requiring a customer to design its own chip, it creates a new strategic option between buying NVIDIA and building an internal ASIC program.


Third-order effect: semiconductor value may shift from chips toward integrated inference systems.


Etched’s own evolution suggests that the economic unit is moving upward from the accelerator die to the rack or cluster. Memory, networking, cooling, power delivery, software and manufacturing become part of competitive differentiation.


Third-order effect: capital intensity spreads downstream.


If specialized inference becomes a major infrastructure category, large venture-funded companies may need hundreds of millions or billions of dollars to finance fabrication, inventory, systems and customer deployments before revenue scales. The distinction between venture capital and industrial project finance begins to blur.


Broader Economic Implications


Etched is one small company relative to the global semiconductor market, so macro claims should be restrained. But the financing contributes to several larger patterns.


AI is becoming more industrial. Capital is flowing not only into software but into fabs, packaging, memory, data centers, power, cooling, networking and purpose-built systems.


Inference efficiency has downstream economic significance. If specialized hardware materially lowers the cost per useful token, then applications that are currently uneconomic can become viable. That can affect pricing for AI software, enterprise automation and agentic workloads.


Hardware competition may also shift capital allocation. The stronger the evidence that inference supports multiple architectures, the more venture and growth capital may move toward specialized silicon, memory systems, networking and infrastructure software.


At the same time, the market risks overinvestment. High private valuations and massive compute commitments can create excess capacity if model monetization fails to scale at the pace assumed by infrastructure investors.


Risks to Etched


Technology risk. Performance claims may narrow under independent testing or production conditions. Different workloads may reduce the theoretical advantage of specialization.


Architecture risk. Although Etched’s 2026 system appears broader than the original transformer-only thesis, rapid changes in model architecture can still invalidate hardware assumptions.


Software risk. NVIDIA’s most durable moat is not only silicon. CUDA, libraries, tooling, developer familiarity and system integration create powerful switching costs.


Manufacturing risk. First-pass silicon is a major achievement but does not guarantee high-yield volume production across multiple generations.


Supply-chain risk. Etched depends on advanced foundry capacity, packaging, memory and other constrained semiconductor inputs.


Execution risk. Scaling from a few racks to gigawatt-scale deployments is an industrial challenge substantially harder than producing working A0 silicon.


Customer concentration risk. Only Jane Street is currently publicly identified. More than $1 billion in contracts could still be concentrated in a small number of counterparties.


Capital risk. Building inventory and production capacity may require further large financings before cash generation becomes self-sustaining.


Valuation risk. At $21 billion, execution disappointments can create severe private-market repricing even if the company remains technologically viable.


Incumbent-response risk. NVIDIA has the resources to respond through product acceleration, pricing, financing, software integration, partnerships or acquisition/licensing strategies.


Hyperscaler risk. The largest potential customers may prefer their own TPU, Trainium, Maia or MTIA systems rather than buying from a merchant startup.


Risks to Investors


The current round has unusually high expectations embedded in the entry price.


A successful product launch is not sufficient. Investors need Etched to sustain a major competitive position over multiple product generations.


Future dilution could materially raise required exit values. A capital-intensive company may need several more large rounds.


Private-market headline valuation does not disclose preference terms. Investors entering at different rounds may have very different downside protection.


The customer-investor overlap is both strength and risk. Strategic investors can accelerate adoption, but commercial relationships may make market demand appear stronger than it would under purely arm’s-length procurement.


Liquidity is uncertain. An eventual IPO must support a valuation far above current levels for venture-style returns, while strategic acquisition at extreme valuations becomes difficult because only a small set of buyers could finance it and antitrust considerations may constrain some obvious acquirers.


Risks to the Industry


Large financings can accelerate competitive innovation, but they can also distort market behavior.


Capital crowding. Well-funded hardware companies can bid aggressively for scarce semiconductor talent and supply capacity, raising costs for smaller entrants.


Supply concentration. More accelerator designs still depend on a small number of foundries, advanced packaging providers and memory suppliers.


Architecture fragmentation. Heterogeneous hardware can improve efficiency but increase software and operational complexity across the ecosystem.


Overcapacity. If inference demand disappoints, capital-intensive accelerator and data-center investments could create stranded or underutilized assets.


Synchronized assumptions. Many current AI infrastructure investments depend on the same premise: rapidly rising inference demand and sustained willingness to pay. Correlated error in that assumption would affect labs, clouds, chipmakers, power developers and infrastructure financiers simultaneously.


Scenario Analysis


Base Case


Etched successfully ramps production, converts a meaningful portion of its current contracts into recognized revenue and demonstrates superior inference economics on selected frontier workloads. It becomes a credible second-source or specialized accelerator supplier for several AI labs, clouds and high-performance enterprises. NVIDIA remains dominant overall, but Etched captures a defensible high-value niche and grows into a major infrastructure company.


Signals supporting this case: several named production customers; independent benchmark validation; repeat orders; evidence of improving gross margins; second-generation silicon delivered on schedule; expansion beyond Jane Street without sacrificing performance.


Upside Case


Inference becomes substantially larger than training in total compute spend, and workloads increasingly reward specialization. Etched’s architecture demonstrates a durable cost and power advantage while its system integration reduces migration friction. Hyperscalers use Etched as a merchant alternative to internal ASIC programs, AI labs adopt the systems at multi-gigawatt scale, and the company becomes an independent platform with economics closer to a leading accelerator vendor than a niche chip supplier.


In this case, a valuation above $100 billion becomes plausible.


Signals supporting this case: multi-gigawatt customer commitments, very strong gross margins, broad model compatibility, major cloud distribution, sustained performance-per-watt advantage over two NVIDIA generations, rapid third-generation product execution.


Downside Case


Etched’s initial systems work but deliver a narrower advantage than expected once real-world utilization, software costs and new NVIDIA platforms are considered. The $1 billion-plus contracts convert slowly, customers retain Etched as experimental capacity rather than core production infrastructure, and hyperscalers prioritize internal silicon. High production spending forces further financing, compressing returns for current investors.


Signals supporting this case: delayed deliveries, limited independent benchmarking, cancellations or contract slippage, continued customer anonymity, heavy pricing discounts, rising inventory, repeated financing before meaningful revenue, slower roadmap execution.


Solten & Co. Thesis


The Etched financing is evidence that the AI accelerator market is moving from a single dominant architecture toward a portfolio of workload-specific compute systems.


The important economic variable is not “Can Etched beat NVIDIA?” in the abstract. It is whether the cost of inference becomes large and repetitive enough that customers are willing to accept hardware and software fragmentation in exchange for materially better tokens per dollar, tokens per watt and latency on specific high-value workloads.


If that threshold has been crossed, Etched does not need to replace NVIDIA. It needs to become economically indispensable for a sufficiently large subset of inference.


The round suggests sophisticated investors believe that subset may be very large.


Counter-Thesis


The strongest counter-thesis is that the market is overestimating the value of specialized silicon while underestimating the value of general-purpose platform integration.


NVIDIA can amortize R&D across a vastly larger installed base, improve hardware every generation, bundle networking and systems, subsidize adoption through financing and maintain developer lock-in through CUDA. Hyperscalers can optimize internally for their own workloads without paying a merchant supplier margin.


Etched therefore occupies a difficult middle position: more specialized and less ecosystem-rich than NVIDIA, but less vertically integrated with end-customer demand than Google or AWS custom silicon.


The company must show that its system-level efficiency advantage is large enough to overcome that structural disadvantage.


Falsification Criteria


The Solten & Co. thesis would weaken materially if several of the following occur:


  • independent production benchmarks show only modest total-cost advantage over NVIDIA or hyperscaler alternatives;
  • customer contracts fail to convert into deployments and recognized revenue;
  • the majority of demand remains concentrated in Jane Street or one or two counterparties;
  • new model architectures materially reduce the efficiency of Etched’s hardware approach;
  • NVIDIA’s next two platform generations close most of the tokens-per-watt or latency gap;
  • Etched requires repeated large financings without corresponding commercial scale;
  • software migration becomes a persistent barrier to production adoption;
  • hyperscalers refuse to adopt merchant specialized inference hardware because internal chips are economically superior.


Key Unknowns


The public investment case remains constrained by missing information. The highest-value unanswered questions are:


  1. What is Etched’s recognized revenue today?
  2. How much of the $1 billion-plus contract value is legally binding and non-cancellable?
  3. What is customer concentration?
  4. What is the expected delivery schedule for those contracts?
  5. What are current and expected gross margins per rack?
  6. What is actual production yield?
  7. What is the all-in system cost per token under realistic production workloads?
  8. How does Etched compare with NVIDIA Blackwell and Vera Rubin under identical model, precision, latency and batch conditions?
  9. What percentage of workloads can run without material software modification?
  10. What foundry, HBM and packaging capacity is contractually secured?
  11. How much additional capital will be required before positive free cash flow?
  12. What are the preference and governance terms in the latest round?
  13. How much ownership did Jane Street obtain?
  14. Which frontier AI companies and cloud providers are under contract?
  15. What proportion of current contracts relate to first-generation versus future-generation systems?


What to Watch Next


The next six to eighteen months should provide far more information than the financing announcement itself.


The critical signals are:


  • additional named customers;
  • independent benchmark publication;
  • production shipment volume;
  • contract conversion to revenue;
  • second and third hardware generation milestones;
  • hyperscaler adoption;
  • broader software ecosystem availability;
  • pricing disclosure or customer total-cost evidence;
  • manufacturing scale and yield;
  • additional fundraising;
  • changes in NVIDIA inference pricing and roadmap;
  • competitive launches from Cerebras, AMD, AWS, Google and other accelerator providers;
  • any evidence that Etched is becoming a standard merchant alternative rather than a specialist system for a narrow set of customers.


Research Exhibits


Exhibit 1 — Etched Valuation Trajectory
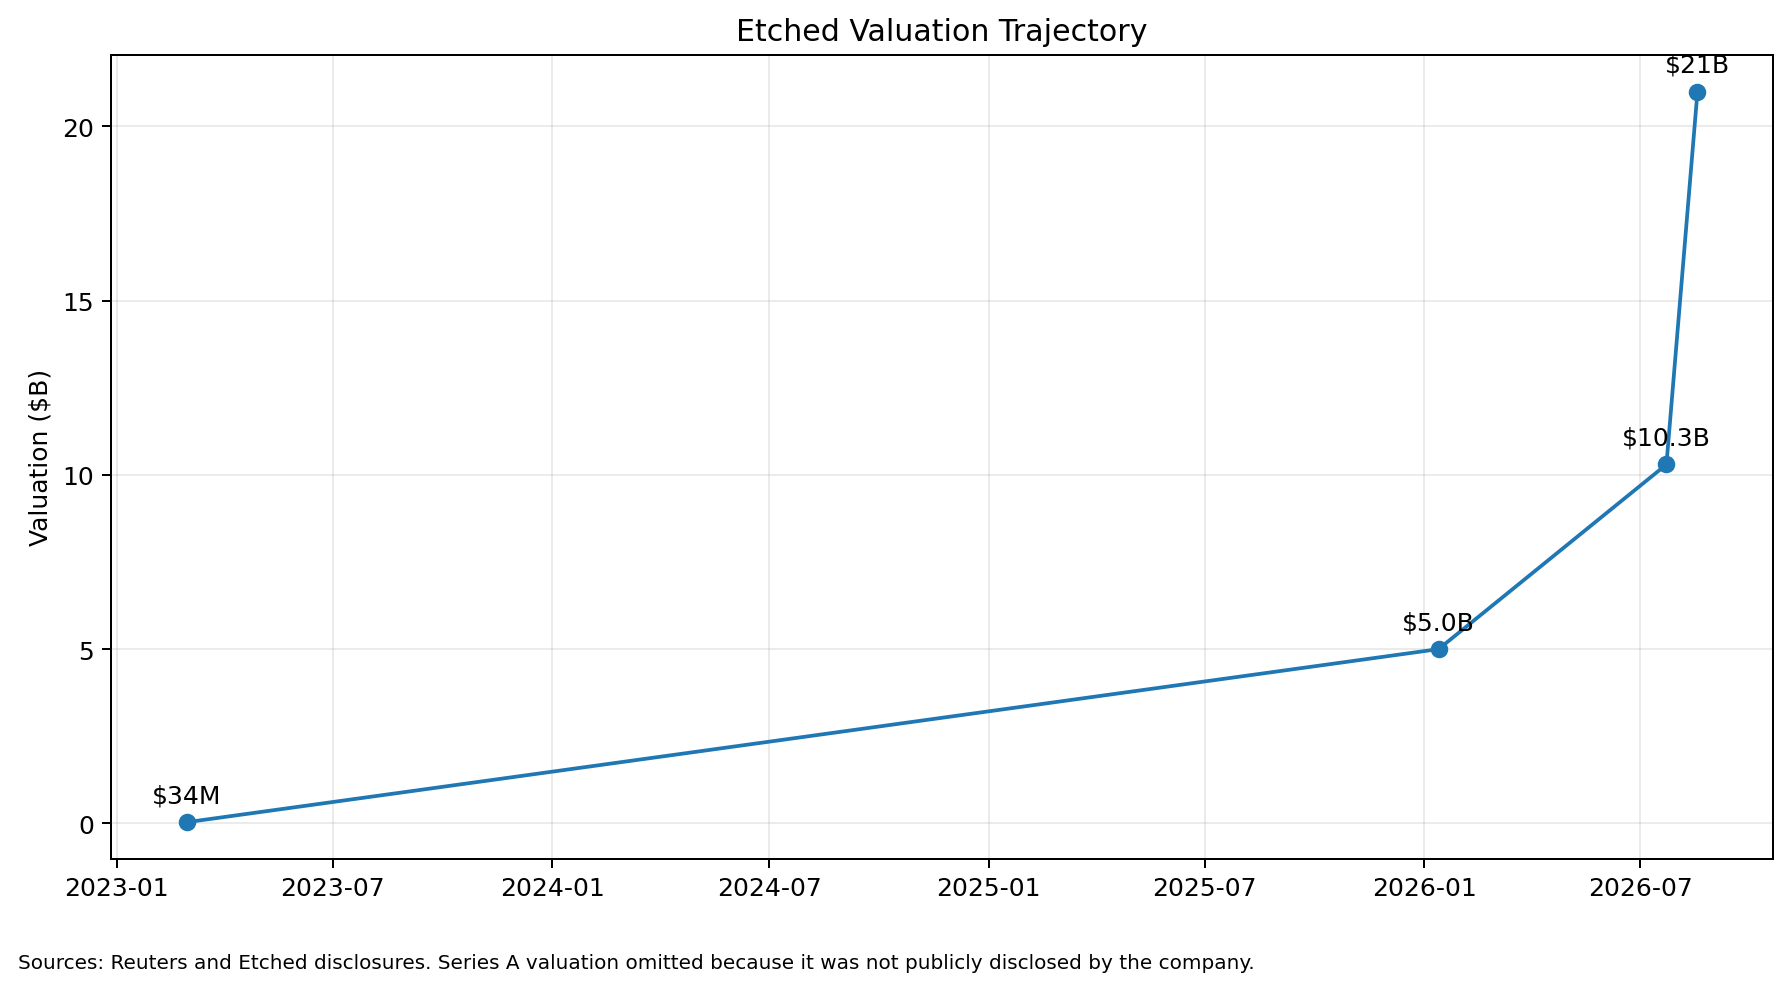
The valuation trajectory illustrates how rapidly market expectations have changed. The Series A valuation is intentionally omitted because Etched did not publicly disclose it at the time.


Exhibit 2 — Known Financing Rounds
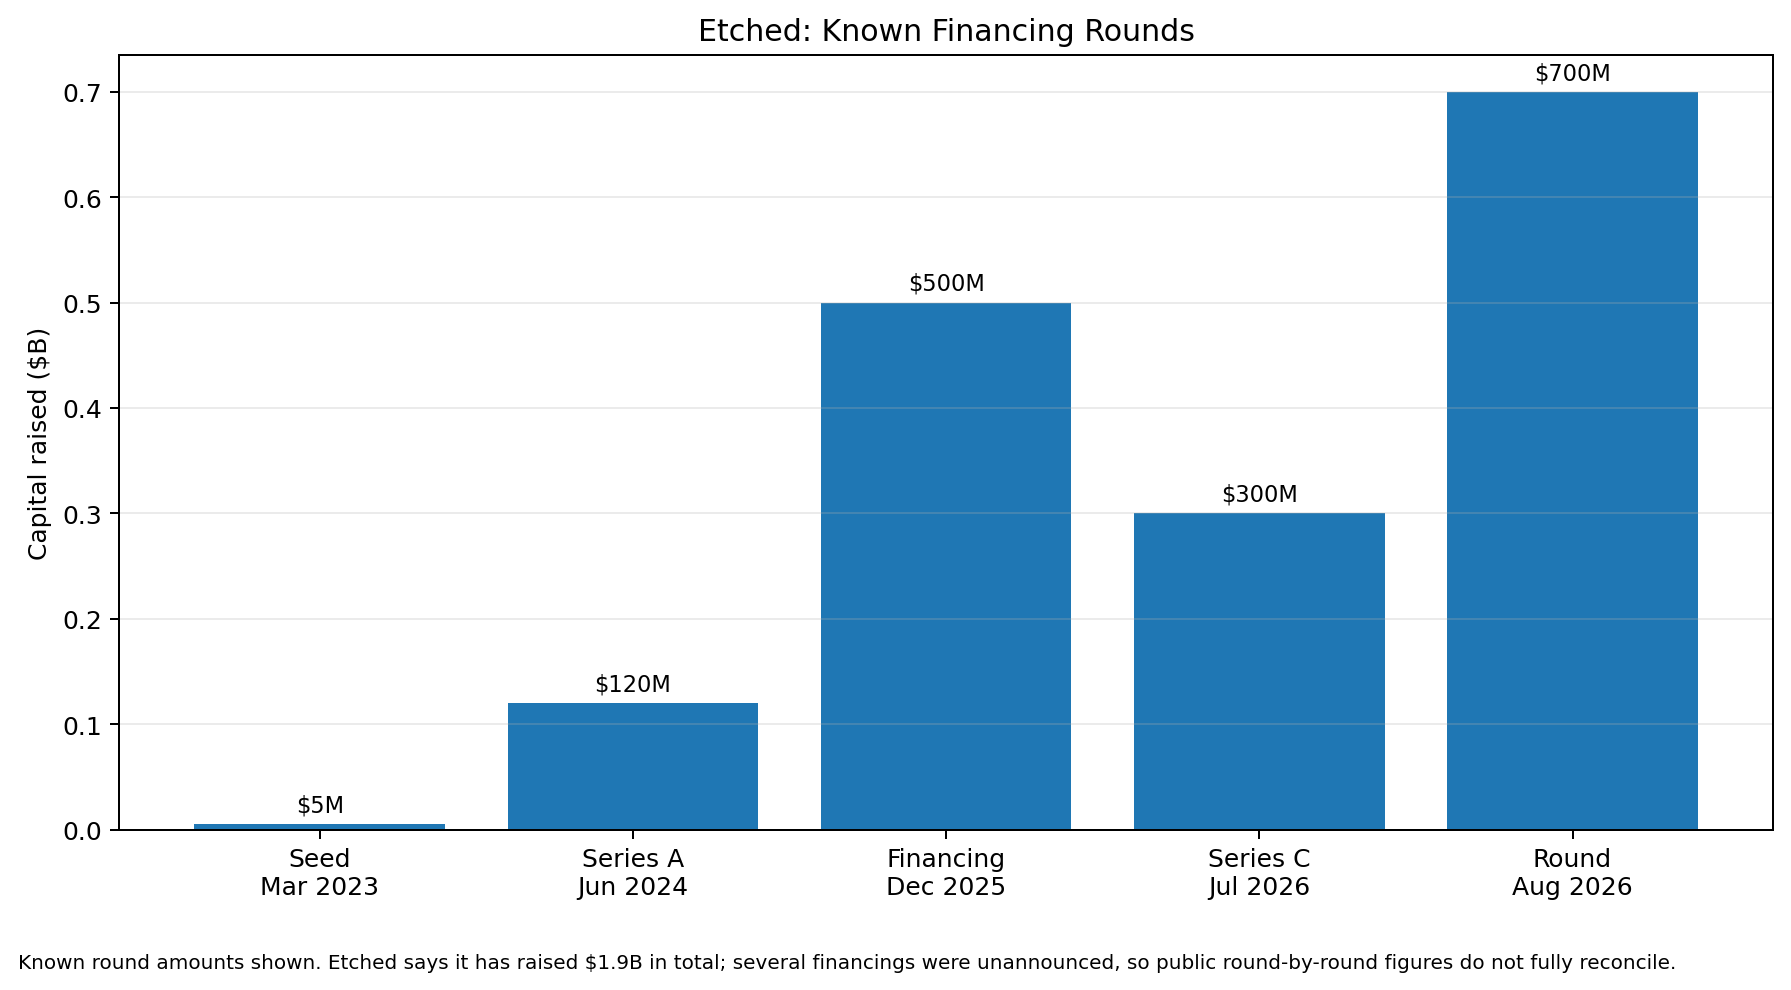
Public financing records do not fully reconcile to Etched’s stated $1.9 billion total because several rounds were unannounced and historical totals were rounded. The correct approach is to preserve that uncertainty rather than manufacture precision.


Exhibit 3 — What a $21 Billion Entry Valuation Implies
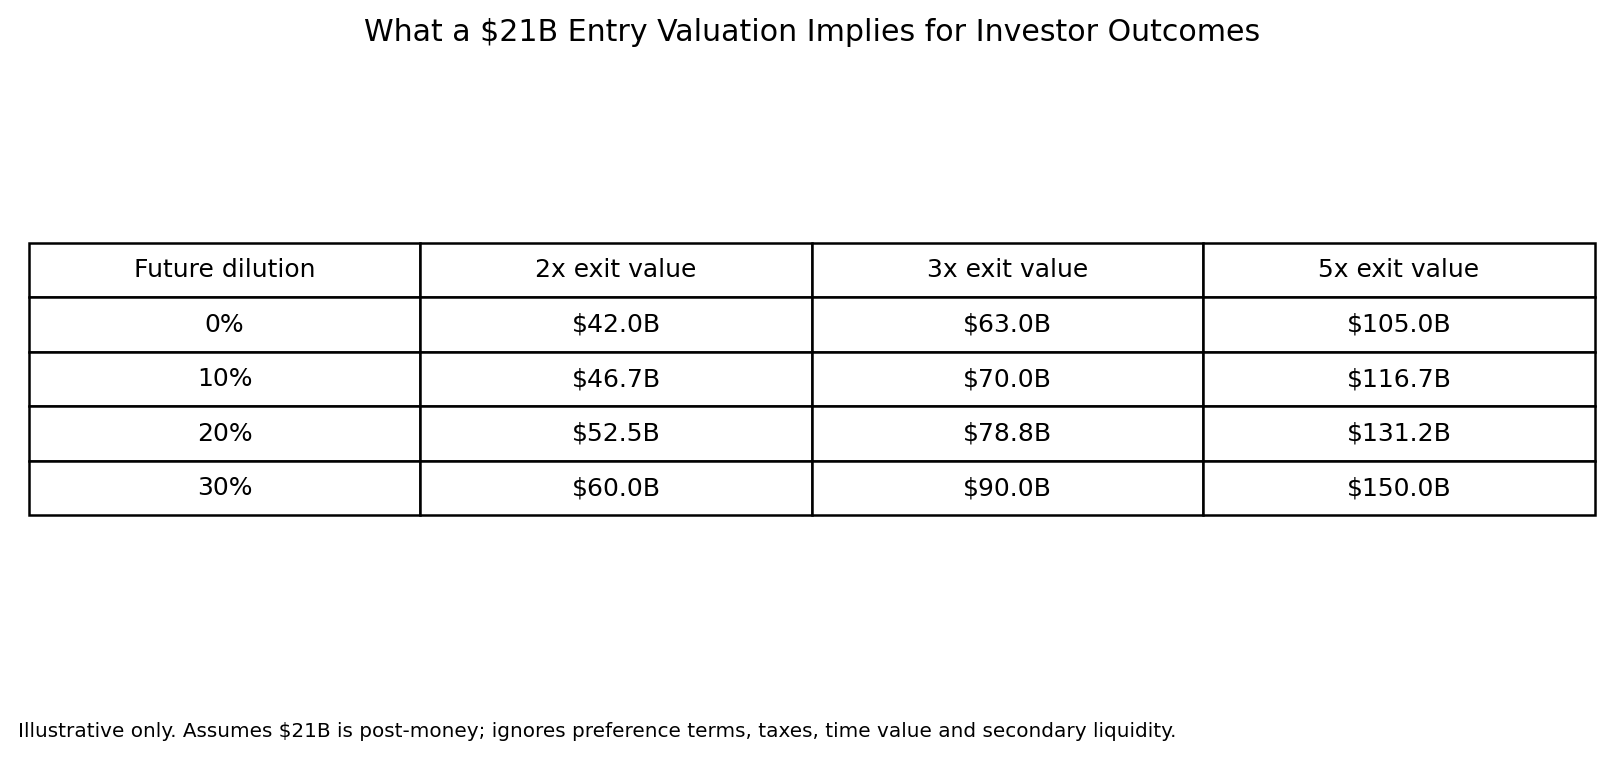
This is an illustrative return-hurdle model, not a valuation forecast. It demonstrates how future dilution raises the exit value required for current investors to achieve venture-style returns.


Sources & Evidence


Primary / company sources


Etched — Frontier Inference Clusters, June 30, 2026

https://www.etched.com/progress/frontier-inference-clusters


Etched — company website and leadership materials

https://www.etched.com/


Etched — $300M financing at $10.3B valuation, July 23, 2026

https://www.globenewswire.com/news-release/2026/07/23/3332366/0/en/Etched-raises-300M-at-a-10-3B-Valuation-to-Scale-Production-of-Frontier-Scale-Inference-Hardware.html


Etched — $700M financing at $21B valuation / first Jane Street delivery, August 18, 2026, company release syndicated by AIwire

https://www.hpcwire.com/aiwire/2026/08/18/etched-raises-700m-at-21b-valuation-and-completes-1st-customer-delivery-to-jane-street/


CoreWeave — Jane Street $6B cloud agreement and $1B equity investment, April 15, 2026

https://www.coreweave.com/news/jane-street-signs-6-billion-ai-cloud-agreement-with-coreweave


NVIDIA — FY2026 annual results

https://investor.nvidia.com/news/press-release-details/2026/NVIDIA-Announces-Financial-Results-for-Fourth-Quarter-and-Fiscal-2026/


NVIDIA — FY2026 Form 10-K

https://www.sec.gov/Archives/edgar/data/1045810/000104581026000021/nvda-20260125.htm


Google Cloud — Anthropic expands TPU usage, April 6, 2026

https://www.googlecloudpresscorner.com/2026-04-06-Anthropic-Expands-Use-of-Google-Cloud-and-TPUs


High-quality reporting / research


Reuters — AI chip startup Etched doubles valuation to $21 billion in under a month, August 18, 2026

https://www.reuters.com/technology/ai-chip-startup-etched-valued-21-billion-latest-funding-round-2026-08-18/


Reuters — Etched raises $120 million to develop specialized chip, June 25, 2024

https://www.reuters.com/technology/artificial-intelligence/ai-startup-etched-raises-120-million-develop-specialized-chip-2024-06-25/


Reuters — Jane Street signs $6B AI cloud deal with CoreWeave, April 15, 2026

https://www.reuters.com/legal/transactional/jane-street-signs-6-billion-ai-cloud-deal-with-coreweave-boosts-stake-2026-04-15/


Reuters — Cerebras launches new inference server system, August 19, 2026

https://www.reuters.com/technology/cerebras-launches-new-server-chip-system-designed-speed-ai-chatbots-2026-08-19/


Reuters — Broadcom signs long-term Google custom AI chip agreement, April 6, 2026

https://www.reuters.com/business/broadcom-signs-long-term-deal-develop-googles-custom-ai-chips-2026-04-06/


TechCrunch — Etched Series C at $10.3B valuation, July 23, 2026

https://techcrunch.com/2026/07/23/ai-chip-startup-etched-defies-skeptics-hits-10-3b-valuation-from-big-name-investors/


TechCrunch — Etched Series A / transformer-only strategy, June 25, 2024

https://techcrunch.com/2024/06/25/etched-is-building-an-ai-chip-that-only-runs-transformer-models/


Primary Venture Partners — Etched Series A thesis / company history

https://www.primary.vc/articles/etcheds-series-a-to-revolutionize-ai-hardware


Academic research — The xPU-athalon: Quantifying the Competition of AI Acceleration, 2026

https://arxiv.org/abs/2604.10852


Methodological Note


This report distinguishes disclosed facts, reported terms, estimates and Solten & Co. interpretation.


DISCLOSED FACT — directly supported by a company, regulatory or authoritative primary source.


REPORTED TERM — reported by a credible secondary source but not independently disclosed in full by the relevant company or counterparty.


ESTIMATE — an analytical calculation based on incomplete public data. Assumptions are stated where material.


SOLTEN & CO. INTERPRETATION — our synthesis or inference from the evidence.


The report does not treat contract value as revenue, valuation as enterprise value, or headline round size as sufficient evidence of ownership. Private-company financial statements, cap-table terms, contract schedules and detailed customer economics are not publicly available. Valuation return scenarios are illustrative and do not represent an investment recommendation.


About Solten & Co.


Solten & Co. is an independent research and analysis firm focused on the AI economy, with deeper research emphasis on AI infrastructure, Physical AI, robotics and autonomous systems. We study the technologies, companies, markets, transactions and capital structures shaping the next phase of AI.

NVIDIA Is Becoming the Financing Layer of AI

How equity, guarantees, and Wall Street partnerships are turning compute deployment into a capital-market strategy.

Solten Research Report
August 21, 2026
AI Infrastructure · Capital & Deals

Research Snapshot

Research type: Flagship Research Report

Evidence cut-off: August 21, 2026

Estimated reading time: ~30 minutes

Executive Summary

NVIDIA’s strategic position in artificial intelligence is changing again. The company first became indispensable as the dominant supplier of accelerated computing. It then expanded the competitive boundary through CUDA, networking, systems and full-stack AI infrastructure. In 2026, a third layer has become increasingly visible: NVIDIA is using equity capital, credit support, guarantees and partnerships with global asset managers to help finance the infrastructure that buys and deploys NVIDIA compute.

This is not a side activity. On August 10, NVIDIA announced memoranda of understanding with Apollo, BlackRock, Blackstone, Brookfield, Goldman Sachs and KKR to create financing platforms intended to mobilize more than $500 billion of third-party capital for AI infrastructure. NVIDIA described the objective explicitly: turn NVIDIA compute and full-stack AI infrastructure into an investable asset class and create dedicated pools of capital for its ecosystem.

One week later, NVIDIA announced a $1.5 billion investment in SB Energy and credit support for the land, power and shell associated with the initial 4.25 IT-GW at the PORTS-Pike Technology Campus in Ohio. OpenAI has agreed to secure approximately 8 IT-GW at the site. NVIDIA will be the exclusive AI compute infrastructure provider. Four days later, NVIDIA disclosed a minority investment in Cloverleaf Infrastructure, a developer focused on power and sites for data-center projects in the United States.

These transactions extend a pattern already visible in NVIDIA’s relationship with CoreWeave. In January 2026, NVIDIA invested $2 billion in CoreWeave as the companies expanded a relationship designed to support more than 5 GW of AI factories by 2030. NVIDIA’s latest Form 10-Q shows how quickly the financial footprint has grown: non-marketable equity securities increased from $3.24 billion in April 2025 to $42.34 billion in April 2026, while total investment commitments reached $27 billion as of April 26, 2026.

The core Solten & Co. thesis is that NVIDIA is evolving from a semiconductor supplier into a deployment orchestrator. It is not merely selling scarce hardware into demand. It is increasingly helping convert future AI demand into financeable infrastructure projects — and in doing so, it can influence which clouds, data-center developers, energy projects and AI labs reach scale.

That strategy can deepen NVIDIA’s moat. If lenders and infrastructure investors become comfortable underwriting assets around NVIDIA systems, the company gains a financing advantage in addition to a technology advantage. Lower financing friction can accelerate customer buildout, expand the installed base, support CUDA adoption and create additional demand for future NVIDIA generations. The financing mechanism can therefore become self-reinforcing.

But the same mechanism also creates a new risk surface. NVIDIA may increasingly have economic exposure to the success of customers, infrastructure developers and AI demand itself. Guarantees and strategic investments can soften the distinction between independent market demand and supplier-supported demand. If compute remains scarce and utilization stays high, this may look like efficient ecosystem financing. If supply catches up, utilization falls or AI-lab economics disappoint, the residual value of GPU-backed projects and the credibility of compute as collateral could be tested.

The right analytical frame is therefore not simply “circular financing.” That phrase is too broad and often conflates equity investments, customer prepayments, credit guarantees, offtake arrangements and independent third-party debt. The more useful question is: how much of AI infrastructure demand is becoming dependent on balance-sheet intermediation by the companies that benefit from the buildout?

Key Findings

  1. NVIDIA is moving upstream into capital formation. Its August 10 partnerships with six major financial institutions are explicitly designed to create dedicated pools of capital for NVIDIA-based AI infrastructure.
  2. The scale is no longer experimental. The financing platforms target more than $500 billion of third-party capital over time, subject to final agreements.
  3. NVIDIA is also using its own balance sheet. Its April 2026 10-Q reported $42.34 billion of non-marketable equity securities and $27 billion of investment commitments.
  4. Strategic finance is now crossing infrastructure layers. NVIDIA has invested in an AI cloud, a data-center and energy developer, and now a powered-site developer, while also providing credit support for land, power and shell.
  5. The PORTS-Pike structure is especially important. NVIDIA is not simply selling chips into the Ohio campus; it is investing in SB Energy, supporting project credit and securing exclusive NVIDIA compute deployment.
  6. Compute is being marketed as collateral. NVIDIA’s financing thesis depends on the proposition that its systems are transferable, fungible across workloads, supported by a deep offtaker ecosystem and capable of producing long-duration usage-linked revenue.
  7. Financial advantage can reinforce technical advantage. If NVIDIA-based projects obtain cheaper or more abundant capital than alternatives, financing becomes part of platform competition.
  8. The risk migrates from inventory to credit and utilization. A future downturn would test GPU residual values, long-term utilization assumptions, customer credit quality and the willingness of third-party financiers to treat compute as infrastructure.
  9. “Circular financing” is an incomplete diagnosis. The material distinction is whether transactions create artificial demand or simply reduce financing friction around demand that already exists.
  10. The next competitive battlefield may be balance-sheet architecture. NVIDIA’s strategy creates a playbook that Google, Broadcom and others can adapt around their own compute ecosystems.

Table of Contents

  1. What Changed
  2. From Chip Supplier to Deployment Orchestrator
  3. The Balance Sheet Has Become Strategic Infrastructure
  4. The $500 Billion Compute-Financing Experiment
  5. PORTS-Pike: Where the Model Becomes Visible
  6. CoreWeave: The Earlier Prototype
  7. Cloverleaf: Moving Upstream Into Power and Sites
  8. Compute as an Asset Class
  9. The Financing Flywheel
  10. Why This Can Strengthen NVIDIA’s Moat
  11. Where Circularity Is Real — and Where It Is Not
  12. The Credit Question
  13. Implications for AI Clouds and Infrastructure Developers
  14. Implications for Capital Markets
  15. Competitive Responses
  16. Solten & Co. Thesis, Counter-Thesis and Falsification
  17. What to Watch

Sources & Evidence

Methodological Note

About Solten & Co.

Scope & Methodology

This report examines the financial architecture developing around NVIDIA’s AI infrastructure ecosystem. It focuses on strategic equity investments, investment commitments, credit support, guarantees and third-party financing platforms that can affect the rate at which NVIDIA-based infrastructure reaches operation.

Primary evidence includes NVIDIA SEC filings, NVIDIA corporate disclosures, CoreWeave SEC filings and corporate releases, and OpenAI’s PORTS-Pike announcement. Reuters and the Financial Times are used for independently reported context where the underlying contractual details are not fully disclosed publicly.

The analysis distinguishes four categories that should not be collapsed into one number: equity investment, contractual investment commitments, credit support or guarantees, and third-party capital mobilization. These categories create different economic exposures and are not additive.

1. What Changed

In prior AI infrastructure cycles, the main strategic question around NVIDIA financing was whether investments in customers and ecosystem companies were helping stimulate purchases of NVIDIA hardware. By August 2026, that question is too narrow.

The company is now designing capital-market infrastructure. Its August 10 announcement with Apollo, BlackRock, Blackstone, Brookfield, Goldman Sachs and KKR states that the parties intend to establish financing platforms for NVIDIA customers and to mobilize more than $500 billion of third-party capital over time. The company’s language matters: NVIDIA wants compute to be treated as “productive, investable infrastructure.”

This marks a shift from bilateral ecosystem support toward an institutionalized financing channel. The objective is not only to invest alongside customers but to make NVIDIA-based compute legible to credit markets, infrastructure funds and other pools of long-duration capital.

The timing is important. AI infrastructure is simultaneously becoming larger, more power-intensive and more capital-intensive. Individual projects increasingly require tens of billions of dollars across land, power, shell, cooling, networking and compute. Even companies with strong equity valuations do not necessarily want to finance the entire stack with corporate cash. The system therefore needs structures that can separate infrastructure ownership from compute demand and connect AI deployment to outside capital.

2. From Chip Supplier to Deployment Orchestrator

NVIDIA’s original economic model was straightforward: design high-value chips and systems, sell them into a rapidly expanding market, and capture unusually high gross margins through superior performance and ecosystem lock-in.

That model remains intact. NVIDIA reported $81.6 billion of revenue in the first quarter of fiscal 2027, including $75.2 billion from Data Center, with a GAAP gross margin of 74.9%.

But as infrastructure scale increases, the limiting factor is no longer chip demand alone. Customers need land, power, buildings, debt capacity, equity capital and credible long-term offtake. A semiconductor vendor that can reduce those constraints increases the probability that its own systems are deployed.

This creates a logical strategic progression:

  • Own the critical compute platform.
  • Expand into networking, systems and software.
  • Invest in the companies that deploy the platform.
  • Use credit support to improve bankability of infrastructure.
  • Bring institutional capital into the ecosystem.
  • Create a secondary financing market around compute assets.

At the limit, NVIDIA does not need to own the data center or become a bank. It only needs enough influence over capital formation to accelerate compatible infrastructure and preserve NVIDIA as the preferred compute standard.

3. The Balance Sheet Has Become Strategic Infrastructure

NVIDIA’s SEC filings make the shift measurable. Non-marketable equity securities rose from $3.24 billion at April 27, 2025 to $42.34 billion at April 26, 2026. NVIDIA also disclosed $27 billion of investment commitments as of April 26, 2026, subject to contingencies and expected to be made through the remainder of fiscal 2027.

The absolute amounts matter less than the rate of change. NVIDIA has accumulated enough financial capacity that strategic investing can influence ecosystem formation without changing the core economics of the chip business.

At April 26, 2026, NVIDIA also held $13.24 billion of cash and cash equivalents, $37.10 billion of marketable debt securities and $30.24 billion of marketable equity securities. Its first-quarter revenue was $81.6 billion. The company therefore has a balance sheet and cash-generation profile that allows it to support projects at a scale that most suppliers could not contemplate.

This is the strategic asymmetry: NVIDIA can use the profits generated by its dominant position to finance more infrastructure that reinforces that position.

4. The $500 Billion Compute-Financing Experiment

On August 10, NVIDIA announced memoranda of understanding with Apollo, BlackRock, Blackstone, Brookfield, Goldman Sachs and KKR to create independent compute-financing platforms. The stated target is to mobilize more than $500 billion of third-party capital over time.

This should not be interpreted as NVIDIA committing $500 billion. It is a target for capital mobilized through external financing platforms, and final agreements remain to be executed.

The more important feature is institutional design. NVIDIA is attempting to establish a recognizable financing category around compute. Goldman Sachs explicitly referred to creating a market for credit backed by NVIDIA compute. NVIDIA argues that its platform is suited to financing because the assets are broadly adopted, flexible across models and workloads, transferable across customers and operators, and continuously improved through CUDA software.

If financiers accept those premises, AI compute begins to resemble infrastructure equipment that can support debt rather than a rapidly depreciating technology asset that requires mostly equity capital.

That change can materially lower the cost of AI deployment. Infrastructure funds and private credit investors generally demand lower returns than venture equity. Moving part of the capital stack from equity to infrastructure-style credit can expand the number of projects that clear their financing hurdle.

5. PORTS-Pike: Where the Model Becomes Visible

The PORTS-Pike Technology Campus in Pike County, Ohio is the clearest current example of NVIDIA’s expanded role.

OpenAI has agreed to secure approximately 8 IT-GW at the campus. NVIDIA will be the exclusive AI compute infrastructure provider. NVIDIA announced a $1.5 billion investment in SB Energy and said it will provide credit support for land, power and shell associated with the initial 4.25 IT-GW, with an option related to the remaining 3.75 IT-GW.

The structure links four different economic actors:

  • OpenAI provides long-duration compute demand.
  • SB Energy develops the physical campus and associated infrastructure.
  • NVIDIA provides compute and financial support.
  • External lenders and capital markets can finance assets against the combination of demand, project infrastructure and NVIDIA credit support.

This is not traditional semiconductor selling. NVIDIA is helping create the project-finance conditions required for the customer to become large enough to buy future NVIDIA systems at extraordinary scale.

Reuters reported that NVIDIA’s potential guarantees could reach as much as $105 billion over the life of the project and relate to key lease and power obligations. Because the full contracts are not public, that figure should be treated as a reported potential exposure rather than a disclosed current liability.

6. CoreWeave: The Earlier Prototype

CoreWeave provides the most developed case of NVIDIA combining technology, customer economics and strategic capital.

In January 2026, NVIDIA invested $2 billion in CoreWeave common stock. The companies simultaneously announced an expanded relationship intended to accelerate more than 5 GW of AI factories by 2030 and to deploy multiple future NVIDIA platform generations.

The relationship is strategically powerful because CoreWeave converts NVIDIA hardware into rented compute. That broadens NVIDIA’s addressable market beyond customers capable of buying clusters outright. It also creates a specialist cloud that can absorb new GPU generations rapidly and make them available to AI labs and enterprises.

The risk is concentration and interdependence. CoreWeave depends heavily on NVIDIA hardware for competitive differentiation, while NVIDIA benefits when CoreWeave obtains the capital and customers required to keep purchasing new generations. The relationship can be economically rational for both parties without being fully independent.

This is why analysis should focus on the quality of end demand. If CoreWeave utilization and customer contracts are strong enough to support its infrastructure economics, NVIDIA’s capital support is an accelerator. If demand weakens, support can become a mechanism that delays price discovery.

7. Cloverleaf: Moving Upstream Into Power and Sites

On August 21, Reuters reported that NVIDIA made a minority investment in Cloverleaf Infrastructure to develop infrastructure that supports AI data-center projects across the United States.

This extends NVIDIA’s strategy farther upstream. A powered site is not a compute asset, but it is a prerequisite for one. In a market where time-to-power is increasingly scarce, investing in site development gives NVIDIA exposure to the earliest stage of the deployment funnel.

The strategic logic is consistent with PORTS-Pike: reduce the number of infrastructure bottlenecks that sit between theoretical GPU demand and an energized cluster.

This also creates a bridge to Solten & Co.’s broader time-to-power thesis. NVIDIA’s financing strategy and power strategy are converging. The company is not merely ensuring that customers can finance chips; it is increasingly participating in the chain that makes a site financeable, powered and capable of hosting those chips.

Exhibit 3 — NVIDIA Is Moving Upstream Across the AI Infrastructure Capital Stack

8. Compute as an Asset Class

The most consequential claim in NVIDIA’s August 10 announcement is not the $500 billion target. It is the assertion that NVIDIA compute can function as an investable asset class.

That claim requires several conditions:

  1. High utilization. Assets must generate enough usage revenue to service debt.
  2. Transferability. If one customer fails, capacity must be redeployable to another.
  3. Residual value. Older generations must retain enough economic utility to support conservative lending assumptions.
  4. Software durability. CUDA and the surrounding ecosystem must extend useful life beyond the hardware’s initial performance frontier.
  5. Deep offtaker markets. Lenders must believe there will be buyers for compute across AI labs, enterprises, sovereign projects and clouds.
  6. Operational reliability. Facilities must deliver uptime and performance consistent with contracted revenue.

NVIDIA can influence several of these variables directly. CUDA improves fungibility across workloads. DGX Cloud Lepton and cloud partnerships can broaden access to offtakers. Frequent hardware generations can increase demand for new assets, although they also create the depreciation risk that lenders must underwrite.

This tension is central. NVIDIA benefits from rapid product cycles, while credit investors prefer stable residual values. The financing market must reconcile those incentives.

9. The Financing Flywheel

The emerging flywheel can be summarized as follows.

NVIDIA technology generates demand. Equity investments, guarantees, and credit support improve project bankability. Third-party capital finances more infrastructure. More infrastructure deploys more NVIDIA systems. A larger installed base expands the CUDA ecosystem and broadens the set of potential offtakers. That makes future NVIDIA-based projects easier to finance.

The flywheel matters because platform dominance can become embedded in financing standards. Once lenders build underwriting models around NVIDIA systems, project templates, resale assumptions, and utilization data can create institutional familiarity. Familiarity lowers transaction costs. Lower transaction costs can reinforce standardization.

This is analogous to other infrastructure markets where financing ecosystems accumulate around dominant equipment, operating models or contractual standards.

10. Why This Can Strengthen NVIDIA’s Moat

NVIDIA’s moat is usually described in technical terms: accelerator performance, CUDA, networking, system design and developer ecosystem. Financing adds another layer.

First, it can expand the customer base. Customers that cannot self-finance large clusters can access third-party capital.

Second, it can accelerate deployment. Credit support can move projects forward before customers accumulate enough cash or equity capital.

Third, it can increase switching costs. Financing documents, residual-value assumptions and infrastructure design may be built around NVIDIA architectures.

Fourth, it can defend against alternative accelerators. A technically credible competing chip may still face a financing disadvantage if lenders, developers and operators are more comfortable with NVIDIA-backed systems.

Fifth, it can make NVIDIA a gatekeeper in ecosystem formation. Strategic investment can influence which clouds, infrastructure developers and adjacent suppliers reach scale.

This is why the financing layer should be analyzed as part of competition, not merely corporate treasury activity.

11. Where Circularity Is Real — and Where It Is Not

The term “circular financing” has become shorthand for transactions in which an AI supplier finances a customer that then uses the proceeds to buy the supplier’s product. But the label can obscure important differences.

A direct equity investment in a customer can be circular in economic effect if the investment is required for the customer to purchase the investor’s product. A guarantee can create similar exposure if it is necessary for lenders to finance an otherwise uneconomic project.

But third-party financing is not automatically artificial demand. If an AI lab has a credible long-term contract for compute and infrastructure investors independently underwrite the project, supplier participation can simply reduce information and execution friction.

The key tests are therefore:

  • Would the end customer demand exist without supplier financing?
  • Is the project economically viable at market financing terms?
  • Are lenders taking genuine independent risk?
  • Does the supplier retain material downside through guarantees or residual-value support?
  • Are utilization and contract assumptions externally verifiable?
  • Does the transaction shift risk or merely hide it?

This framework is more useful than treating every ecosystem investment as evidence of a bubble.

12. The Credit Question

Equity investors can tolerate volatility and long periods before profitability. Credit investors require a different kind of evidence: contracted cash flow, asset recovery value, predictable utilization and enforceable security.

That means the next stage of AI infrastructure will generate new datasets. Lenders will need to understand GPU useful life, resale markets, utilization curves, power-price exposure, customer concentration, software obsolescence and the cost of moving hardware between operators.

In conventional digital infrastructure, lenders can underwrite fiber routes, towers and data-center leases using long operating histories. GPU clusters do not yet have that history at current scale.

That is the hidden importance of NVIDIA’s Wall Street partnerships. The company is not merely seeking more capital. It is helping create the underwriting methodology for a new category of credit.

13. Implications for AI Clouds and Infrastructure Developers

For AI clouds, NVIDIA-backed financing can lower the cost of growth. But it can also increase strategic dependence on one platform and encourage faster expansion than internally generated cash flow would support.

For data-center developers, access to NVIDIA-aligned demand and credit support can improve project financeability. The more valuable the NVIDIA ecosystem becomes to lenders, the more attractive it may be to design facilities around NVIDIA deployment standards.

For power developers, the relationship is moving even earlier in the lifecycle. PORTS-Pike and Cloverleaf show that NVIDIA has an incentive to secure land and power before a cluster exists.

The infrastructure stack is therefore becoming vertically coordinated without necessarily becoming vertically owned.

14. Implications for Capital Markets

If compute-backed credit becomes institutionalized, it can create a large new market spanning private credit, infrastructure debt, securitization, equipment finance and project finance.

The attraction is obvious. AI infrastructure can generate high contracted revenue, and hyperscalers or frontier labs can function as powerful offtakers. The risk is that multiple layers of the capital stack ultimately depend on the same underlying assumption: continued rapid growth in AI demand.

That creates correlation. Equity investors may believe they are financing a cloud company, credit investors a data center, infrastructure investors a power project and NVIDIA shareholders a semiconductor business — while all four returns may depend on the same end customer continuing to buy AI compute.

The financial system can therefore diversify legal entities without fully diversifying economic exposure.

15. Competitive Responses

NVIDIA’s strategy is unlikely to remain unique.

Google has incentives to use its balance sheet and cloud ecosystem to finance TPU deployments. Broadcom’s custom accelerator ecosystem can be paired with structured finance around hyperscaler or AI-lab capacity. Large cloud providers can support partners through leases, guarantees and offtake commitments.

Once financing becomes a competitive tool, accelerator competition can expand from performance-per-dollar into capital-per-deployed-compute: which platform can mobilize the cheapest, fastest and most scalable financing around its ecosystem.

This may favor companies with investment-grade balance sheets, large cash flows and established relationships with global capital providers.

16. Solten & Co. Thesis, Counter-Thesis and Falsification

Solten & Co. Thesis

NVIDIA is becoming the financing layer of the AI infrastructure ecosystem. Its strategic advantage increasingly combines technology, software, installed base, balance-sheet capacity and the ability to mobilize third-party capital. If compute develops into an accepted infrastructure asset class, NVIDIA can reinforce its platform moat by lowering the financing friction of NVIDIA-based deployment.

Counter-Thesis

The financing strategy may be a temporary response to an unusually tight market rather than a durable moat. GPU supply could normalize, customers could diversify toward custom accelerators, and rapid hardware generations could make residual-value underwriting difficult. If AI infrastructure returns compress, lenders may discover that “compute as an asset class” behaves more like cyclical technology equipment than long-duration infrastructure. NVIDIA could then be left with investment losses, guarantee exposure and customers that expanded too aggressively.

Falsification Criteria

  • The announced $500 billion financing platforms fail to reach final agreements or mobilize material third-party capital.
  • NVIDIA-backed projects require progressively larger guarantees to clear financing markets.
  • Secondary-market values for older NVIDIA systems fall too quickly to support meaningful secured lending.
  • Utilization or pricing for AI compute declines enough to make debt service materially less robust.
  • Alternative accelerator ecosystems obtain comparable financing terms without NVIDIA’s installed-base advantage.
  • Strategic investments generate repeated impairments or fail to translate into durable NVIDIA platform demand.
  • Credit investors materially increase spreads or reduce advance rates on GPU-backed infrastructure.

17. What to Watch

Final terms of the $500 billion financing platforms. The memoranda of understanding are not yet final agreements. Watch how much direct risk NVIDIA retains.

NVIDIA’s August 26 earnings and filings. Additional disclosure on investment commitments, guarantees and strategic investments could clarify the scale of balance-sheet exposure.

PORTS-Pike financing. The eventual debt structure, guarantee mechanics and lender base will provide a benchmark for large AI project finance.

GPU-backed lending terms. Advance rates, depreciation assumptions, covenants and collateral substitution rules will reveal how credit markets value compute.

CoreWeave utilization and leverage. It remains one of the most important real-world tests of whether specialist AI-cloud economics can support large infrastructure commitments.

Cloverleaf project conversion. Watch whether powered-site origination translates into NVIDIA-exclusive or NVIDIA-preferred deployments.

Competitor financing structures. Google, Broadcom and hyperscalers are the most important reference points.

Residual values. The resale and redeployment economics of Hopper, Blackwell, Rubin and subsequent generations will determine whether compute behaves like durable collateral.

Sources & Evidence

Primary sources

NVIDIA — AI Compute Infrastructure Financing Platforms, August 10, 2026

https://investor.nvidia.com/news/press-release-details/2026/NVIDIA-Partners-With-Apollo-BlackRock-Blackstone-Brookfield-Goldman-Sachs-and-KKR-to-Establish-AI-Compute-Infrastructure-Financing-Platforms-to-Mobilize-Over-500-Billion-of-Third-Party-Capital/default.aspx

NVIDIA — PORTS-Pike Technology Campus Credit Support, August 17, 2026

https://investor.nvidia.com/news/press-release-details/2026/NVIDIA-Guarantees-SB-Energys-PORTS-Pike-Technology-Campus-in-Ohio-to-Exclusively-Host-NVIDIA-AI-Compute/default.aspx

OpenAI — OpenAI joins PORTS-Pike project, August 17, 2026

https://openai.com/index/openai-joins-ports-pike-project/

NVIDIA — Form 10-Q for quarter ended April 26, 2026

https://www.sec.gov/Archives/edgar/data/1045810/000104581026000052/nvda-20260426.htm

NVIDIA — Fiscal 2027 First Quarter Results, May 20, 2026

https://investor.nvidia.com/news/press-release-details/2026/NVIDIA-Announces-Financial-Results-for-First-Quarter-Fiscal-2027/default.aspx

CoreWeave — Form 8-K / NVIDIA $2 billion investment, January 2026

https://www.sec.gov/Archives/edgar/data/1769628/000176962826000044/crwv-20260123.htm

CoreWeave / NVIDIA — Expanded AI Factory Collaboration, January 26, 2026

https://www.sec.gov/Archives/edgar/data/1769628/000176962826000044/ex991pressrelease_final.htm

High-quality reporting

Reuters — NVIDIA invests in Cloverleaf Infrastructure, August 21, 2026

https://www.reuters.com/technology/nvidia-invests-data-center-developer-cloverleaf-infrastructure-2026-08-21/

Reuters — NVIDIA to provide up to $105 billion guarantee for OpenAI Ohio data center, August 17, 2026

https://www.reuters.com/business/media-telecom/nvidia-invest-15-billion-sb-energy-under-openai-data-center-deal-2026-08-17/

Financial Times — NVIDIA looks well placed to benefit from the next stage of the AI boom, August 20, 2026

https://www.ft.com/content/b388be2e-67bd-4056-abd2-234e17819a98

Methodological Note

This report does not aggregate NVIDIA equity investments, investment commitments, potential guarantees and third-party capital targets into a single exposure number because they represent different economic obligations.

The $500 billion figure is a target for third-party capital to be mobilized by financing platforms and is subject to final agreements. The reported potential $105 billion PORTS-Pike guarantee is based on Reuters reporting and is not treated as an existing funded liability. NVIDIA’s disclosed $1.5 billion SB Energy investment and credit support for initial land, power and shell capacity are treated separately.

The term financing layer is a Solten & Co. analytical concept. It describes NVIDIA’s emerging role in reducing capital-formation friction around AI infrastructure; it does not imply that NVIDIA is a regulated bank or that all NVIDIA ecosystem financing is controlled by NVIDIA.

The Return of Marginal Cost

How to underwrite AI-native software when usage, quality and economics move
together.

KEY THESIS  The correct unit of analysis is the accepted workflow—not the seat, token or API call. Falling model prices help, but durable economics appear only when value captured per accepted workflow improves faster than total workflow intensity, rework and non-model variable costs.

Research snapshot

Field Detail
Research question How should investors underwrite AI-native application software when marginal cost, output quality and customer value all vary with usage?
Evidence cut-off 25 August 2026
Audience Family offices, venture/growth investors, lean investment teams and strategy leaders
Reading time 12–15 minutes
Scope Application-layer economics; not a company rating, financing analysis or valuation opinion

Executive summary

Software investors learned to value businesses whose cost of serving an additional user approached zero. AI reintroduces a meaningful variable-cost stack: model inference, tool calls, retrieval, orchestration, evaluation, human review and support. The familiar SaaS shorthand—annual recurring revenue, seats and gross margin—still matters, but it can hide whether greater adoption makes the product economically stronger or merely more expensive to operate.

The market’s first instinct has been to treat inference prices as the answer. That is too simple. Stanford’s AI Index found that the cost of querying a model with GPT-3.5-level benchmark performance fell from about $20 per million tokens in November 2022 to $0.07 by October 2024, a decline of more than 280 times.[1] Yet an agent that makes five times as many model calls, uses longer contexts or triggers more tools can consume the entire saving. An 80% decline in unit price combined with a fivefold increase in workload leaves total model cost unchanged.

Quality makes the equation harder. In a field study of 5,179 customer-support agents, generative AI raised issues resolved per hour by 14% on average and by 34% for novice and lower-skilled workers.[5] In a separate experiment involving 758 consultants, people working inside the technology’s capability frontier completed more tasks, worked faster and produced higher-quality output; on a task outside that frontier, AI users were 19 percentage points less likely to reach the correct answer.[6] The economic value of AI therefore depends on the workflow, the user and the cost of detecting failure—not merely on access to a capable model.

Our conclusion is that investors need a new primary unit: contribution margin per accepted workflow. “Accepted” means the customer or a defined control process accepts the output without material rework, reversal or undisclosed human completion. Revenue should be measured against every variable cost required to produce that accepted result, including failed attempts and escalations. This approach makes unlike pricing models comparable and exposes companies whose apparent automation is funded by invisible labour or unchecked risk.

What changed

  • Intelligence became a metered input. API calls, context length, output length, tools and agent loops can all scale with use.[8], [13], [14]
  • Quality became part of unit economics. Evaluation, monitoring and human review are operating costs, especially where errors are consequential.[7], [20], [21]
  • Pricing moved beyond seats. Vendors now combine subscriptions, credits, usage and outcomes, shifting cost and quality risk between buyer and seller.[9], [10], [12], [23]
  • Model choice became an optimisation layer. Routing, caching and asynchronous processing can reduce cost, but add engineering and governance complexity.[15]–[18], [24], [25]
  • Gross-margin dispersion widened. Selected high-growth private AI companies report economics far below mature public SaaS benchmarks.[2]–[4]

Exhibit 1. Benchmark orientation: the margin gap is real, but the samples are not comparable

Sources: Salesforce FY2025 Form 10-K; ServiceNow FY2025 Form 10-K; Bessemer State of AI 2025. Salesforce figure calculated as 1 − $6.198bn / $35.679bn. Bessemer figures are selected private-company averages, not audited market benchmarks.[2]–[4]

The first mistake: treating token deflation as margin expansion

Model prices have fallen quickly, and providers offer cheaper cached input, asynchronous batches and smaller models.[13]–[15], [24], [25] Those mechanisms can improve cost. They do not determine total workflow economics. A workflow may become more ambitious as models improve: longer contexts, more retrieval, parallel agents, repeated reasoning, tool calls and verification. In agentic systems, model calls can branch or loop. Both Anthropic and the major cloud platforms advise using the simplest architecture that meets the task because added autonomy trades cost and latency for performance.[16]–[18], [26], [27]

Exhibit 2. Unit-cost deflation versus workload expansion

Source: Solten & Co. illustrative model. Each cell is (1 − unit-price decline) × workload multiplier. It excludes non-model costs and is not a forecast.

The implication is practical. Management should report both the price paid per unit of compute and the number of units required per accepted result. If model cost per token falls 50% while tokens per accepted workflow triple, model cost per accepted workflow rises 50%. A company that highlights the first number and omits the second is not showing its economics.

The second mistake: measuring automation without acceptance

An automation rate can overstate value if it counts attempts rather than accepted results. A workflow may appear automated while customers reopen cases, employees rewrite the output or a hidden operations team completes exceptions. NIST treats confabulation and downstream reliance as material risks; Google’s deployment guidance describes evaluation as a core operating process and notes that manual evaluation can become a bottleneck.[7], [20]

The quality-adjusted automation rate should therefore be calculated as accepted outcomes divided by attempted workflows. The definition of acceptance must be tied to the customer’s job: a support resolution that is not reopened, code that passes tests and is merged, a claim that survives audit, or a document approved without material rewrite. Intercom’s published approach separates AI involvement from resolution and charges for defined outcomes rather than unsuccessful attempts, illustrating the direction of travel even though the exact commercial definition remains vendor-specific.[10], [11]

Exhibit 3. A four-layer underwriting hierarchy

Source: Solten & Co. framework.

The six metrics that matter

Metric Definition Why investors need it
Contribution margin / accepted workflow Revenue less all variable model, tool, infrastructure, review, support and risk costs, divided by accepted workflows Reveals whether usage creates economic value
Quality-adjusted automation Accepted outcomes ÷ attempted workflows Prevents failed attempts and hidden labour from appearing automated
Workload elasticity Change in model calls, tokens and tools per workflow relative to unit-price change Tests whether cost deflation survives product ambition
Cost-to-serve distribution P50, P90 and P99 variable cost by customer/cohort/workflow Exposes heavy users and tail-risk contracts
Retention after novelty Cohort retention and expansion after initial experimentation Separates durable workflow ownership from curiosity
Provider dependency Share of cost and quality tied to one model/provider; time and quality loss to switch Measures bargaining power and resilience

Pricing is a risk-allocation decision

Seat pricing gives customers budget certainty but leaves the vendor exposed when usage varies widely. Pure usage pricing transfers much of that risk to the buyer, though it can weaken adoption. Outcome pricing aligns with value only where the result is observable and reversals are measurable. Hybrid pricing—base subscription plus included credits or usage—often provides the best bridge because it combines predictability with a limit on unbounded cost. GitHub Copilot’s plans, for example, combine subscription tiers with included AI credits; Stripe documents subscription, usage, outcome and hybrid patterns for AI companies.[8], [9], [12], [23]

What investors should ask

  • What exactly is an accepted outcome, and how often is it reversed, reopened or materially edited?
  • Show revenue, model cost, tool cost, human review and support per accepted workflow—monthly and by cohort.
  • How do P90 and P99 customers compare with the median? Which contracts are contribution-negative?
  • If model prices fall 80%, how much more inference does the product consume? If prices rise or discounts disappear, what reprices?
  • How much labour sits outside cost of revenue? What happens to gross margin if evaluation and review are classified consistently?
  • Does retention persist after experimentation? Is expansion caused by greater customer value or merely by more metered usage?
  • Can the company route across models without losing quality? What proprietary context, distribution or integration survives model commoditisation?

Counter-thesis

The strongest counterargument is that this framework may overstate the break from SaaS. Inference prices could fall faster than workloads expand; products could standardise; customers could continue to prefer simple subscriptions; and many AI features may become low-cost functionality inside conventional software. If those conditions hold, mature AI applications could converge toward classic software margins. The framework would then remain useful mainly during the transition.

That counter-thesis is falsifiable. We would reduce the weight placed on accepted-workflow economics if several conditions persist across cohorts: model and tool cost per workflow falls faster than usage expands; human escalation approaches zero without worsening outcomes; P90 cost-to-serve converges toward the median; retention remains strong after novelty; and vendors achieve public-software gross margins without restricting useful consumption. Until then, the burden of proof should remain on the unit economics.

What to watch

  • Contribution margin per accepted workflow, especially for mature cohorts.
  • Tokens, model calls and paid tool calls per workflow as capability expands.
  • Reopen, reversal, escalation and material-edit rates—not only vendor-reported automation.
  • P90/P99 cost-to-serve and the share of negative-contribution customers.
  • Pricing migration: unlimited seats toward credits, usage caps, outcomes or hybrids.
  • Multi-model routing, caching and batch adoption, with quality held constant.
  • Retention and expansion after pilots convert into production workflows.
  • Gross-margin reconciliation: whether human operations, evaluation and support sit in cost of revenue.

Conclusion

AI-native software can become an exceptional business. It can also look like software while carrying the economics of a service, an infrastructure layer or an insurance contract. The distinction is not visible in ARR alone. It appears at the level of the accepted workflow: what the customer values, what it costs to deliver reliably, how often automation truly succeeds and who bears the tail risk. The companies that learn to improve that equation—through product design, routing, proprietary context, distribution and disciplined pricing—will turn cheaper intelligence into durable margin. The rest may discover that marginal cost did not disappear. It merely moved.

Sources and evidence

Evidence cut-off: 25 August 2026. Vendor pricing and implementation pages are used to document commercial structures and technical mechanisms, not to validate vendor performance. Private-company benchmarks are attributed and treated as directional. Adjacent citations are separated for legibility.

  1. Stanford HAI, AI Index 2025: inference cost decline for GPT-3.5-level performance. Source
  2. Bessemer Venture Partners, The State of AI 2025: private-company growth and gross-margin archetypes. Source
  3. Salesforce FY2025 Form 10-K: subscription and support revenue and cost. Source
  4. ServiceNow FY2025 Form 10-K: subscription gross-profit percentage. Source
  5. NBER, Generative AI at Work: field study of 5,179 customer-support agents. Source
  6. Dell’Acqua et al., Organization Science, Navigating the Jagged Technological Frontier. Source
  7. NIST AI 600-1, Artificial Intelligence Risk Management Framework: Generative AI Profile. Source
  8. Stripe, AI companies and usage-based billing. Source
  9. Stripe, AI pricing models. Source
  10. Intercom, Fin AI Agent outcomes and outcome pricing. Source
  11. Intercom, Fin AI Agent automation rate. Source
  12. GitHub, Copilot plans and included AI credits. Source
  13. OpenAI API pricing. Source
  14. Anthropic API pricing and prompt-caching structure. Source
  15. Google Gemini API, context caching. Source
  16. Anthropic, Building effective agents. Source
  17. AWS Bedrock, Intelligent Prompt Routing. Source
  18. AWS, Generative AI Lens — Well-Architected Framework. Source
  19. Google Cloud Architecture Framework, AI and ML cost optimisation. Source
  20. Google Cloud, deploy and operate generative AI applications. Source
  21. OpenAI API reference, Evals. Source
  22. AWS Bedrock, cost allocation by request. Source
  23. Stripe, token-based billing implementation patterns. Source
  24. OpenAI, Prompt Caching. Source
  25. OpenAI API reference, Batch API. Source
  26. Google Cloud, choosing a design pattern for an agentic AI system. Source
  27. AWS Prescriptive Guidance, cost optimisation for agentic AI. Source

Research disclosure

This report is independent research for informational purposes. It is not investment, legal, tax or accounting advice and does not recommend a security or transaction. The analysis relies on public information available by the evidence cut-off. Illustrative scenarios are analytical tools, not forecasts. Private-company operating data are incomplete; readers should obtain company-level cohort, billing, inference and support records before making an investment decision.